## Line Chart: Hits@10 Values vs. Training Epochs
### Overview
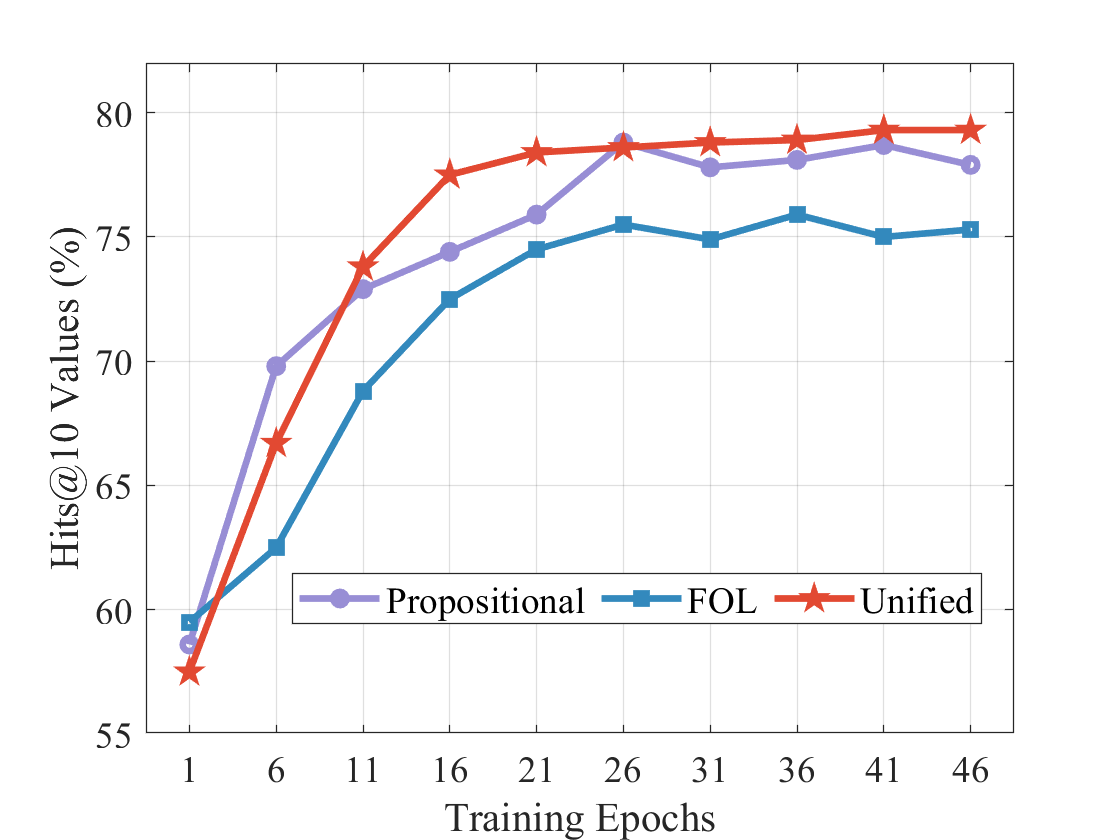
This line chart depicts the performance of three different models ("Proportional", "FOL", and "Unified") over 46 training epochs, measured by the "Hits@10 Values (%)" metric. The chart illustrates how the performance of each model evolves as it undergoes more training.
### Components/Axes
* **X-axis:** "Training Epochs" - Ranges from 1 to 46, with markers at intervals of 5.
* **Y-axis:** "Hits@10 Values (%)" - Ranges from 55% to 80%, with markers at intervals of 5.
* **Legend:** Located at the bottom-center of the chart.
* "Proportional" - Represented by a light purple line with circle markers.
* "FOL" - Represented by a blue line with square markers.
* "Unified" - Represented by a red line with star markers.
### Detailed Analysis
The chart displays three distinct lines, each representing a model's performance.
* **Proportional (Light Purple):** The line starts at approximately 61% at epoch 1, rises steadily, plateaus around 76% between epochs 21 and 41, and then slightly decreases to approximately 75% at epoch 46.
* Epoch 1: ~61%
* Epoch 6: ~66%
* Epoch 11: ~70%
* Epoch 16: ~73%
* Epoch 21: ~75%
* Epoch 26: ~75%
* Epoch 31: ~76%
* Epoch 36: ~76%
* Epoch 41: ~76%
* Epoch 46: ~75%
* **FOL (Blue):** The line begins at approximately 60% at epoch 1, exhibits a rapid increase up to epoch 16, reaching around 73%, then continues to rise more slowly, reaching approximately 78% at epoch 46.
* Epoch 1: ~60%
* Epoch 6: ~67%
* Epoch 11: ~71%
* Epoch 16: ~73%
* Epoch 21: ~75%
* Epoch 26: ~76%
* Epoch 31: ~77%
* Epoch 36: ~78%
* Epoch 41: ~79%
* Epoch 46: ~78%
* **Unified (Red):** The line starts at approximately 58% at epoch 1, shows a steep increase until epoch 11, reaching around 74%, then continues to rise at a decreasing rate, leveling off around 79-80% between epochs 26 and 46.
* Epoch 1: ~58%
* Epoch 6: ~65%
* Epoch 11: ~74%
* Epoch 16: ~77%
* Epoch 21: ~78%
* Epoch 26: ~79%
* Epoch 31: ~79%
* Epoch 36: ~80%
* Epoch 41: ~80%
* Epoch 46: ~79%
### Key Observations
* The "Unified" model consistently outperforms the other two models across all training epochs.
* The "FOL" model shows the most significant initial improvement in performance.
* The "Proportional" model exhibits the slowest rate of improvement and plateaus earlier than the other models.
* All three models demonstrate diminishing returns in performance as training progresses beyond 26 epochs.
### Interpretation
The chart suggests that the "Unified" model is the most effective at learning the underlying patterns in the data, as evidenced by its consistently higher "Hits@10 Values (%)" score. The initial rapid improvement of the "FOL" model indicates that it quickly learns basic relationships, but its performance eventually plateaus. The "Proportional" model's slower improvement suggests it may be less capable of capturing complex relationships or requires more training data. The diminishing returns observed in all models after a certain number of epochs indicate that further training may not yield significant performance gains. This could be due to the model reaching its capacity to learn from the available data or the onset of overfitting. The choice of model would depend on the trade-off between training time, computational resources, and desired performance level.