## Line Chart: Hits@10 Values (%) vs. Training Epochs
### Overview
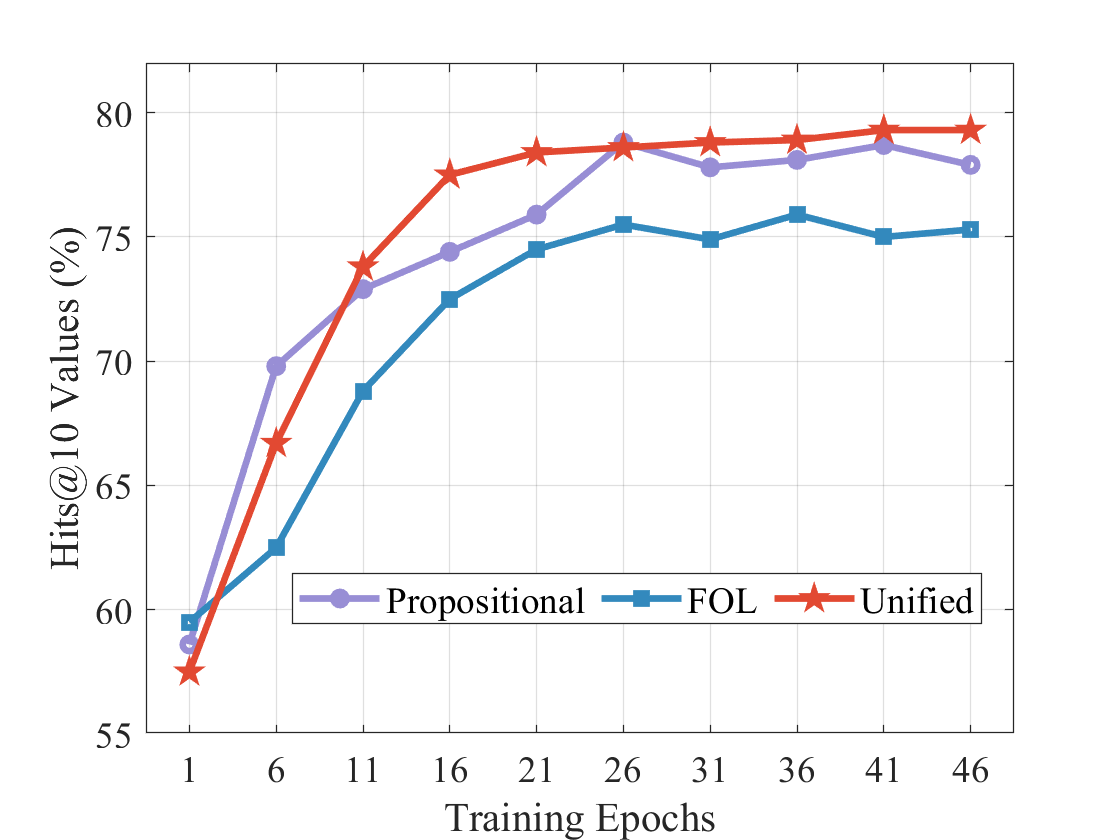
This image is a line chart comparing the performance of three different models or methods—labeled "Propositional," "FOL," and "Unified"—over the course of training. Performance is measured by the "Hits@10 Values (%)" metric, plotted against the number of "Training Epochs." The chart demonstrates how each method's accuracy evolves and stabilizes as training progresses.
### Components/Axes
* **Chart Type:** Multi-line chart with markers.
* **Y-Axis:**
* **Label:** `Hits@10 Values (%)`
* **Scale:** Linear, ranging from 55 to 80.
* **Major Ticks:** 55, 60, 65, 70, 75, 80.
* **X-Axis:**
* **Label:** `Training Epochs`
* **Scale:** Linear, with labeled ticks at specific intervals.
* **Major Ticks (Labeled):** 1, 6, 11, 16, 21, 26, 31, 36, 41, 46.
* **Legend:**
* **Position:** Centered at the bottom of the chart area.
* **Entries:**
1. **Propositional:** Represented by a purple line with circular markers (●).
2. **FOL:** Represented by a blue line with square markers (■).
3. **Unified:** Represented by a red line with star markers (★).
### Detailed Analysis
The following table reconstructs the approximate data points for each series, derived from visual inspection of the chart. Values are estimates based on marker positions relative to the grid lines.
| Training Epoch | Propositional (Purple, ●) | FOL (Blue, ■) | Unified (Red, ★) |
| :--- | :--- | :--- | :--- |
| **1** | ~58.5% | ~59.5% | ~57.5% |
| **6** | ~70.0% | ~62.5% | ~66.5% |
| **11** | ~73.0% | ~68.8% | ~74.0% |
| **16** | ~74.5% | ~72.5% | ~77.5% |
| **21** | ~76.0% | ~74.5% | ~78.5% |
| **26** | ~79.0% | ~75.5% | ~78.8% |
| **31** | ~78.0% | ~75.0% | ~79.0% |
| **36** | ~78.2% | ~76.0% | ~79.2% |
| **41** | ~78.8% | ~75.0% | ~79.5% |
| **46** | ~78.0% | ~75.2% | ~79.5% |
**Trend Verification:**
* **Unified (Red ★):** Shows the steepest initial ascent, surpassing the other two series by epoch 11. It continues to rise steadily, plateauing at the highest value (~79.5%) from epoch 41 onward.
* **Propositional (Purple ●):** Also rises sharply in early epochs, peaking at epoch 26 (~79.0%). After this peak, it exhibits a slight, gradual decline, ending at ~78.0%.
* **FOL (Blue ■):** Demonstrates the most gradual and consistent increase. It never surpasses the other two series after the initial epoch. Its performance stabilizes in the mid-70s range from epoch 21 onward.
### Key Observations
1. **Performance Hierarchy:** After the very first epoch, a clear and consistent performance hierarchy is established and maintained: **Unified > Propositional > FOL**.
2. **Convergence:** All three methods show signs of convergence (performance plateau) after approximately 25-30 training epochs.
3. **Early Dynamics:** The most significant performance gains for all models occur within the first 15-20 epochs.
4. **Stability:** The "Unified" method appears the most stable at its peak, showing almost no decline. The "Propositional" method shows a minor but noticeable performance drop after its peak. The "FOL" method is stable but at a lower performance level.
### Interpretation
The data suggests that the "Unified" approach is the most effective for this task, as measured by Hits@10 accuracy. It not only learns faster (steeper initial slope) but also achieves a higher final performance ceiling than the "Propositional" and "FOL" (First-Order Logic) methods.
The "Propositional" method performs strongly initially, even matching "Unified" at epoch 26, but its slight subsequent decline could indicate a tendency toward mild overfitting or instability in later training stages compared to the unified model.
The "FOL" method, while showing steady learning, consistently underperforms the other two. This might imply that the constraints or representations inherent to pure first-order logic are less expressive or less suited for this specific learning task compared to the propositional or unified representations.
The chart effectively demonstrates the advantage of the "Unified" model, which likely combines the strengths of the other two paradigms, resulting in superior and more robust learning outcomes over the full training cycle. The plateau across all models indicates that further training beyond ~45 epochs is unlikely to yield significant improvements for any of these approaches.