## Line Chart: Hits@10 Values vs Training Epochs
### Overview
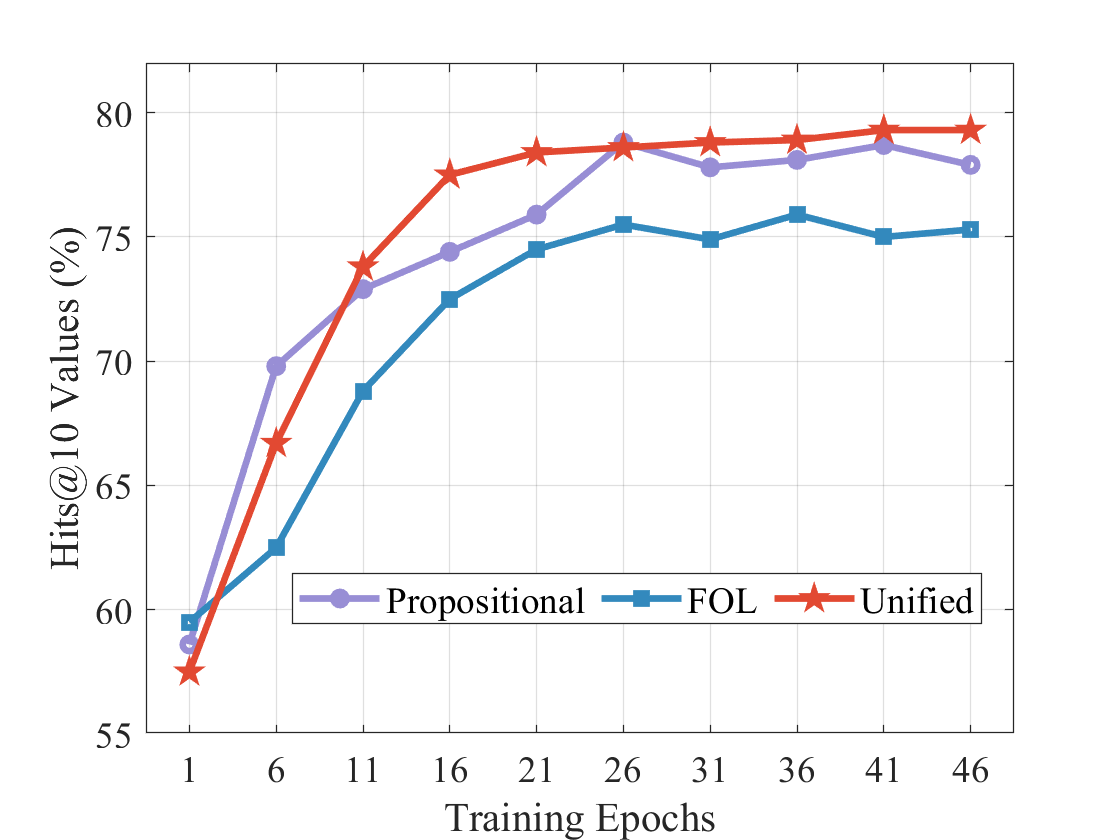
The chart compares three optimization methods (Proportional, FOL, Unified) across 46 training epochs, measuring Hits@10 performance in percentage. All three methods show improvement over time, with Unified consistently outperforming the others after ~11 epochs.
### Components/Axes
- **X-axis**: Training Epochs (1–46, labeled at intervals of 5)
- **Y-axis**: Hits@10 Values (%) (55–80%, labeled in 5% increments)
- **Legend**: Located at bottom-right, with:
- Purple circles: Proportional
- Blue squares: FOL
- Red stars: Unified
### Detailed Analysis
1. **Proportional (Purple Circles)**
- Starts at ~58% at epoch 1
- Rises steadily to ~79% by epoch 26
- Slight decline to ~78% by epoch 46
- Notable dip between epochs 26–31 (~79% → ~78%)
2. **FOL (Blue Squares)**
- Begins at ~59% at epoch 1
- Gradual ascent to ~75% by epoch 21
- Stabilizes between 75–76% from epochs 26–46
- Minor fluctuation: ~75% → ~76% → ~75% → ~76%
3. **Unified (Red Stars)**
- Starts lowest at ~57% at epoch 1
- Sharp rise to ~74% by epoch 11
- Peaks at ~79% by epoch 26
- Maintains ~79–80% from epochs 26–46
- Final value: ~80% at epoch 46
### Key Observations
- **Unified** achieves highest performance by epoch 11 and maintains lead
- **Proportional** shows fastest initial growth but plateaus earlier
- **FOL** demonstrates slowest improvement but stabilizes at mid-range performance
- All methods converge near 75–80% by epoch 36, with Unified sustaining highest values
### Interpretation
The data suggests Unified optimization is most effective for this task, achieving 80% Hits@10 by final epoch. Proportional's early dominance followed by slight decline may indicate overfitting or parameter sensitivity. FOL's gradual improvement suggests robustness but lower ceiling performance. The convergence near 75–80% implies diminishing returns after ~36 epochs for all methods. Unified's sustained lead highlights its architectural or algorithmic advantages in this context.