## Bar Charts: Token Frequency Distribution for Questions and Answers
### Overview
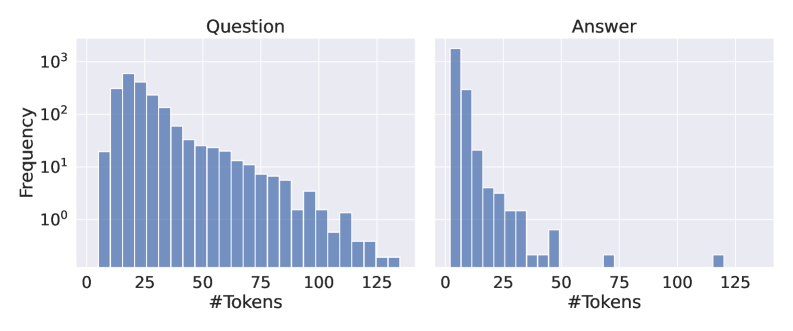
The image contains two side-by-side bar charts comparing the frequency distribution of token counts for "Questions" and "Answers." Both charts use a logarithmic y-axis (Frequency) ranging from 10⁰ to 10³ and a linear x-axis (#Tokens) from 0 to 125. The charts reveal distinct patterns in token usage for questions versus answers.
### Components/Axes
- **X-axis (Horizontal)**: Labeled "#Tokens," with increments at 0, 25, 50, 75, 100, and 125.
- **Y-axis (Vertical)**: Labeled "Frequency," using a logarithmic scale (10⁰, 10¹, 10², 10³).
- **Bars**: Blue-colored bars represent frequency counts. No explicit legend is present, but the color is consistent across both charts.
- **Titles**:
- Left chart: "Question"
- Right chart: "Answer"
### Detailed Analysis
#### Question Chart
- **Trend**: Frequencies decrease monotonically as token count increases.
- **Key Data Points**:
- Highest frequency (~10³) occurs at 10–15 tokens.
- Frequencies drop to ~10² at 25 tokens and ~10¹ at 75 tokens.
- Minimal frequency (~10⁰) observed beyond 100 tokens.
- **Distribution**: Long-tailed distribution with a sharp decline after 25 tokens.
#### Answer Chart
- **Trend**: Similar decreasing pattern but with a steeper drop-off.
- **Key Data Points**:
- Peak frequency (~10³) at 0–5 tokens.
- Rapid decline to ~10² at 10 tokens and ~10¹ at 25 tokens.
- Near-zero frequencies beyond 50 tokens.
- **Distribution**: Even more concentrated than questions, with a pronounced tail cut-off after 25 tokens.
### Key Observations
1. **Shorter Dominance**: Both questions and answers are predominantly short, with >90% of instances containing ≤25 tokens.
2. **Answer Conciseness**: Answers exhibit a more extreme concentration of short tokens compared to questions.
3. **Logarithmic Scale Impact**: The y-axis compression emphasizes the disparity in high-frequency ranges (10⁰–10³) versus low-frequency tails.
4. **Token Thresholds**:
- Questions: 75–100 tokens mark the transition to negligible frequency.
- Answers: 50 tokens represent the effective upper limit for non-zero frequency.
### Interpretation
The data suggests a strong preference for brevity in both questions and answers, with answers being significantly more concise. The logarithmic scale highlights the dominance of short tokens, implying that most interactions involve minimal token usage. This could reflect user behavior favoring efficiency or system design constraints (e.g., token limits in models). The steeper decline in answers may indicate that responses are often direct and to the point, whereas questions might require slightly more elaboration. The absence of data beyond 125 tokens suggests either a lack of such instances or a truncation mechanism in the dataset.