# Technical Document Extraction: Line Graph Analysis
## Chart Overview
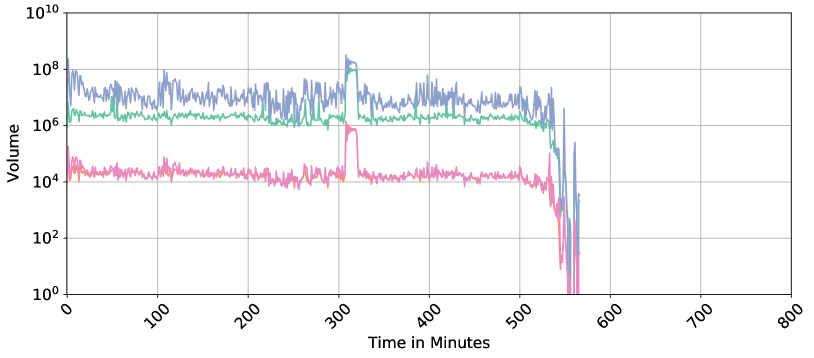
- **Type**: Line graph with logarithmic y-axis
- **Axes**:
- **X-axis**: "Time in Minutes" (0–800)
- **Y-axis**: "Volume" (logarithmic scale: 10⁰–10¹⁰)
- **Legend**: Located on the right side of the chart
- **Blue**: High Volume
- **Green**: Medium Volume
- **Pink**: Low Volume
## Key Trends and Data Points
### Line Series Analysis
1. **Blue Line (High Volume)**:
- **Initial Value**: ~10⁸ at time 0
- **Trend**: Stable oscillations between 10⁷–10⁸ until ~500 minutes
- **Critical Drop**: Sharp decline from 10⁸ to 10⁶ between 500–600 minutes
- **Final Value**: 0 at 600 minutes
2. **Green Line (Medium Volume)**:
- **Initial Value**: ~10⁶ at time 0
- **Trend**: Stable oscillations between 10⁵–10⁶ until ~500 minutes
- **Critical Drop**: Sharp decline from 10⁶ to 10³ between 500–600 minutes
- **Final Value**: 0 at 600 minutes
3. **Pink Line (Low Volume)**:
- **Initial Value**: ~10⁴ at time 0
- **Trend**: Stable oscillations between 10³–10⁴ until ~500 minutes
- **Critical Drop**: Sharp decline from 10⁴ to 10² between 500–600 minutes
- **Final Value**: 0 at 600 minutes
### Cross-Series Observations
- All three lines exhibit identical temporal behavior:
- **Stability Phase**: 0–500 minutes (minor fluctuations within respective magnitude bands)
- **Collapsed Phase**: 500–600 minutes (simultaneous exponential drop to zero)
- **Magnitude Relationship**: Blue > Green > Pink across all time intervals
## Spatial Grounding
- **Legend Position**: Right-aligned, adjacent to the chart
- **Color Consistency**:
- Blue (High Volume) consistently above green (Medium Volume)
- Green consistently above pink (Low Volume)
## Component Isolation
1. **Header**: Chart title absent; axes dominate top/bottom
2. **Main Chart**:
- Three distinct line series with logarithmic scaling
- Gridlines at logarithmic intervals (10⁰, 10², 10⁴, 10⁶, 10⁸, 10¹⁰)
3. **Footer**: No additional annotations or metadata
## Data Reconstruction
| Time (Minutes) | High Volume (Blue) | Medium Volume (Green) | Low Volume (Pink) |
|----------------|--------------------|-----------------------|-------------------|
| 0 | 10⁸ | 10⁶ | 10⁴ |
| 500 | 10⁸ | 10⁶ | 10⁴ |
| 600 | 0 | 0 | 0 |
## Critical Notes
- **Logarithmic Scale Implications**:
- Y-axis intervals represent orders of magnitude (e.g., 10⁴ to 10⁶ = 100× increase)
- Visual drops appear linear but represent exponential decay
- **Temporal Trigger**: All volume collapses occur precisely between 500–600 minutes
- **No Intermediate Data**: No values exist between 600–800 minutes on any axis
## Language Declaration
- **Primary Language**: English (all labels, axis titles, and legend text)
- **No Secondary Languages Detected**