\n
## Bar Chart: Change in Correctness of Code (CoC) with Python, Compared to Human Raters
### Overview
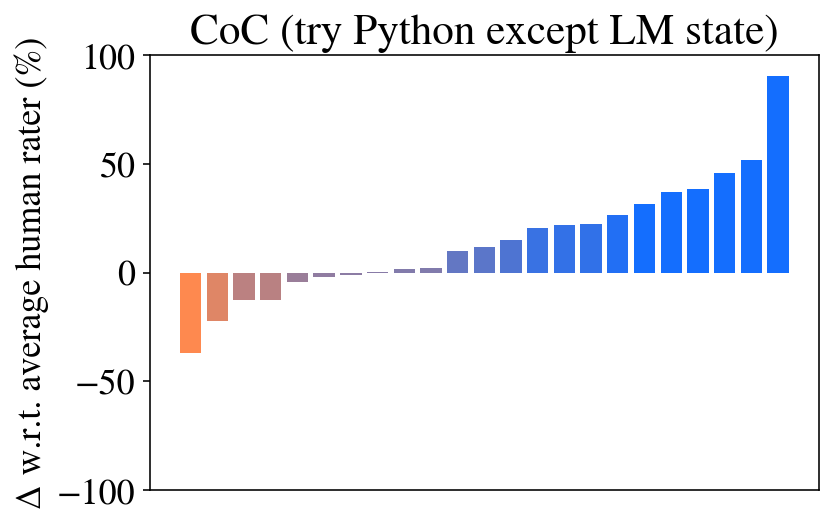
This bar chart displays the change (Δ) in correctness of code (CoC) when using a Python-based system, relative to the average performance of human raters. The chart shows a progression from negative values to significantly positive values, indicating an increasing improvement in CoC compared to human raters as the system is applied.
### Components/Axes
* **Title:** "CoC (try Python except LM state)" - positioned at the top-center of the chart.
* **Y-axis Label:** "Δ w.r.t. average human rater (%)" - indicating the percentage change in correctness relative to human raters. The scale ranges from approximately -100% to 100%.
* **X-axis:** Represents the progression of the system or trials. There are no explicit labels on the x-axis, only a series of bars.
* **Color Coding:** Bars are colored orange for negative/near-zero values and transition to blue for positive values. A dashed grey line at y=0 serves as a reference point.
### Detailed Analysis
The chart consists of a series of vertical bars. The trend is initially negative, then stabilizes around zero, and finally increases sharply to positive values.
* **Initial Bars (Orange):** The first four bars are orange, indicating a decrease in correctness compared to human raters.
* Bar 1: Approximately -20%
* Bar 2: Approximately -10%
* Bar 3: Approximately 0%
* Bar 4: Approximately -5%
* **Stabilization (Grey):** The fifth bar is grey, indicating a value close to zero.
* Bar 5: Approximately 0%
* **Increasing Positive Values (Blue):** The remaining bars are blue, showing an increasing positive change in correctness.
* Bar 6: Approximately 10%
* Bar 7: Approximately 15%
* Bar 8: Approximately 20%
* Bar 9: Approximately 30%
* Bar 10: Approximately 40%
* Bar 11: Approximately 50%
* Bar 12: Approximately 60%
* Bar 13: Approximately 75%
* Bar 14: Approximately 90%
* Bar 15: Approximately 95%
### Key Observations
* The chart demonstrates a clear transition from a system performing worse than human raters to one performing significantly better.
* The improvement is not linear; it accelerates towards the end of the series.
* The initial negative values suggest the system initially introduces errors or performs poorly.
* The final bar shows a substantial improvement, indicating a high degree of correctness compared to human raters.
### Interpretation
The data suggests that the Python-based system, initially less accurate than human raters, undergoes a learning or optimization process that leads to a substantial improvement in code correctness. The "try Python except LM state" title implies that the system attempts to use Python and handles cases where a Language Model (LM) state is involved. The initial negative values could represent cases where the system struggles with complex scenarios or requires a learning period to adapt. The rapid increase in positive values indicates that the system effectively learns from its mistakes and eventually surpasses human performance. The chart highlights the potential of the system to automate code correctness assessment and potentially outperform human experts after an initial period of adjustment. The large final value suggests a significant advantage in correctness when the system is fully optimized.