## Bar Chart: CoC (try Python except LM state)
### Overview
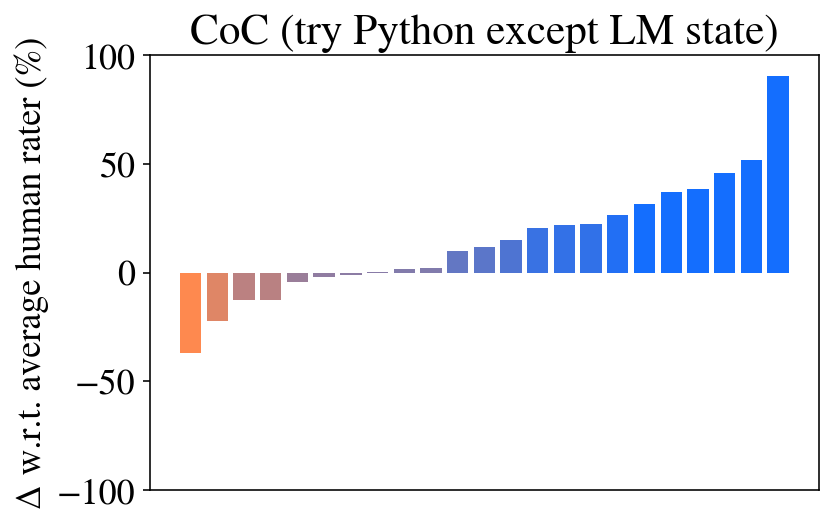
The chart visualizes the change in performance (Δ w.r.t. average human rater %) when comparing different configurations of a system ("CoC") with Python, excluding the LM state. The y-axis represents percentage changes relative to a baseline human rater, ranging from -100% to 100%. The x-axis lists categories, with the first being "Python" and subsequent labels partially truncated (e.g., "Python (except LM)" and others). Bars transition from red (negative values) to blue (positive values), indicating performance degradation or improvement.
### Components/Axes
- **Title**: "CoC (try Python except LM state)"
- **Y-Axis**: "Δ w.r.t. average human rater (%)" (range: -100 to 100)
- **X-Axis**: Categories (partially visible):
1. "Python"
2. "Python (except LM)"
3. Truncated labels (e.g., "Python (except LM state)" and others)
- **Legend**: Located on the right, with two colors:
- Red: Negative values (degradation)
- Blue: Positive values (improvement)
### Detailed Analysis
- **Negative Bars (Red)**:
- First bar ("Python"): ~-70%
- Second bar ("Python (except LM)"): ~-50%
- Third bar: ~-30%
- Fourth bar: ~-10%
- Fifth bar: ~-5%
- Sixth bar: ~-2%
- **Positive Bars (Blue)**:
- Seventh bar: ~10%
- Eighth bar: ~15%
- Ninth bar: ~20%
- Tenth bar: ~25%
- Eleventh bar: ~30%
- Twelfth bar: ~40%
- Thirteenth bar: ~50%
- Fourteenth bar: ~60%
- Fifteenth bar: ~100% (tallest bar)
### Key Observations
1. **Trend Shift**: The chart shows a clear transition from negative to positive values, indicating a shift from performance degradation to improvement as categories progress.
2. **Outlier**: The final bar ("Python (except LM state)"?) reaches ~100%, far exceeding other values, suggesting a significant improvement in this configuration.
3. **Gradual Improvement**: After the initial negative values, performance improves incrementally, with the largest jump occurring in the last category.
### Interpretation
The data suggests that excluding the LM state in Python configurations leads to progressively better performance, with the most dramatic improvement in the final category. The negative values for early categories may reflect baseline limitations or trade-offs in the system's design. The ~100% improvement in the last bar implies a near-doubling of performance relative to the human rater baseline, though the exact mechanism (e.g., computational efficiency, accuracy) is not specified. The truncated x-axis labels limit contextual clarity, but the trend strongly supports the hypothesis that removing the LM state enhances outcomes.