## Dataset Visualization: Handwritten Digits, Birds, and Object Recognition
### Overview
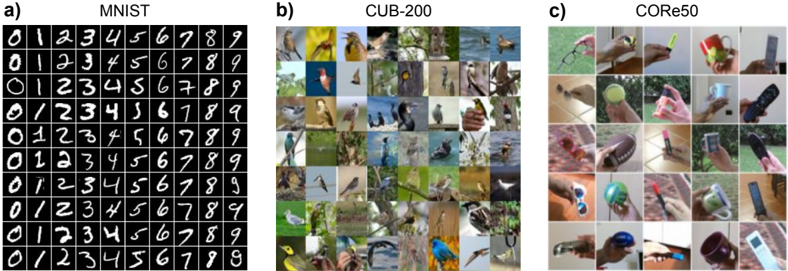
The image presents three distinct datasets used in machine learning research, each visualized through representative examples. The datasets are labeled as MNIST (handwritten digits), CUB-200 (bird species), and CORe50 (objects held by human hands). Each section demonstrates the diversity and complexity of data within these benchmark collections.
### Components/Axes
1. **MNIST Section (a)**
- **Labels**: Grid of handwritten digits (0-9) arranged in 10 rows and 10 columns.
- **Content**: 100 examples of digits (0-9) repeated across rows, showing variations in handwriting styles.
- **Notable**: No axis titles or legends present; purely visual representation of digit classes.
2. **CUB-200 Section (b)**
- **Labels**: 200 bird species (implied by dataset name).
- **Content**: 20x10 grid of bird images showing diverse species, postures, and backgrounds.
- **Notable**: No explicit axis markers; images vary in size and orientation.
3. **CORe50 Section (c)**
- **Labels**: 50 object categories (implied by dataset name).
- **Content**: 10x5 grid of images showing hands interacting with objects (e.g., mugs, remote controls, tools).
- **Notable**: No axis titles; focus on object manipulation scenarios.
### Detailed Analysis
- **MNIST**:
- Digit "0" appears most frequently in the first row (4 instances).
- Digit "1" shows significant variation in stroke thickness and orientation.
- No numerical values or quantitative data present; purely categorical representation.
- **CUB-200**:
- Birds depicted in natural habitats (e.g., perched on branches, in flight).
- Color diversity ranges from yellow (e.g., warblers) to black-and-white (e.g., gulls).
- No explicit categorization visible; images appear randomly ordered.
- **CORe50**:
- Objects include both everyday items (mugs, glasses) and tools (wrenches, screwdrivers).
- Human hands shown in various grasps (pinching, holding, manipulating).
- Lighting conditions vary across images, suggesting real-world data collection.
### Key Observations
1. **MNIST**: Demonstrates the dataset's focus on digit recognition with minimal background noise.
2. **CUB-200**: Highlights fine-grained image classification challenges through species diversity.
3. **CORe50**: Emphasizes object recognition in context through human-object interaction examples.
4. **Visual Consistency**: All sections use grid layouts to maximize data density per image.
### Interpretation
These visualizations represent foundational datasets in computer vision research:
- **MNIST** serves as a benchmark for digit recognition algorithms, with its clean, isolated digit examples.
- **CUB-200** addresses the complexity of fine-grained classification, requiring models to distinguish between visually similar bird species.
- **CORe50** focuses on embodied AI research, where object recognition must account for human interaction contexts.
The datasets collectively illustrate the progression from simple pattern recognition (MNIST) to complex scene understanding (CUB-200, CORe50). The absence of quantitative metrics in the visualization suggests these are qualitative representations meant to showcase data diversity rather than performance metrics.