## Heatmap: DCCA Coefficient Distribution Across European Countries
### Overview
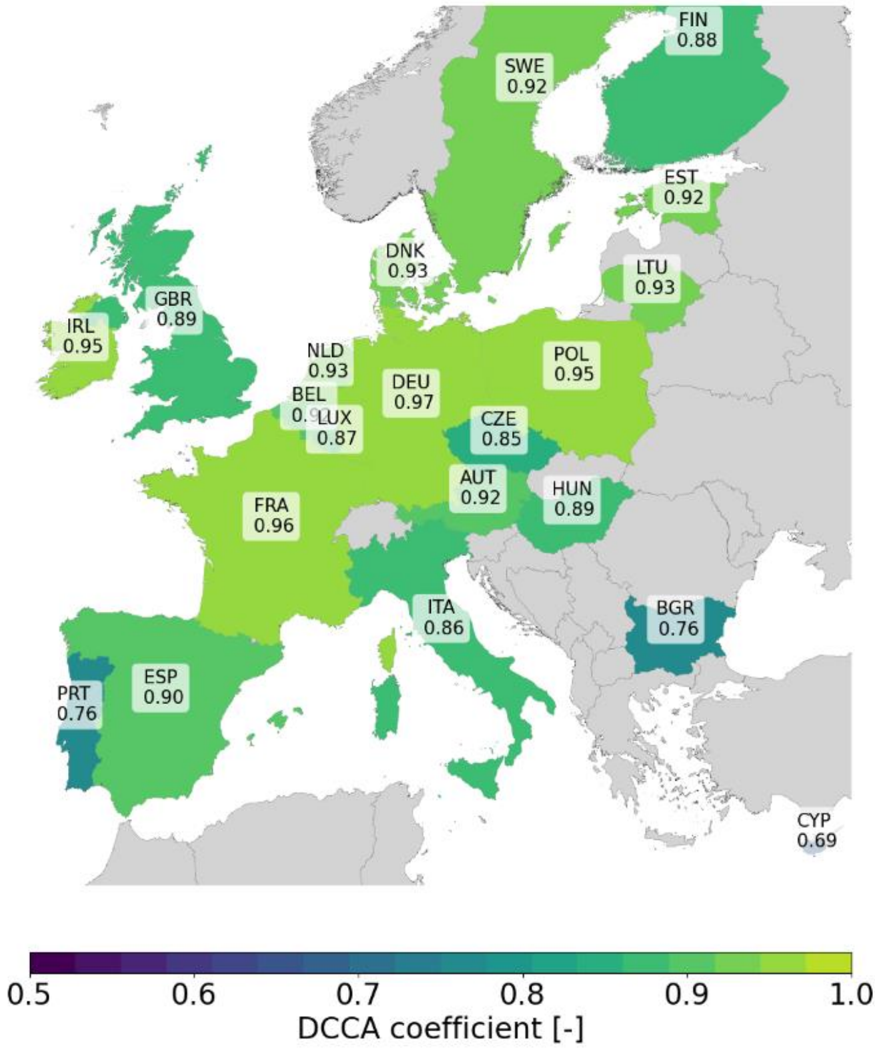
The image is a choropleth map of Europe, color-coded to represent the DCCA (Detrended Cross-Correlation Analysis) coefficient values for each country. Countries are labeled with their ISO codes and numerical values, with a gradient legend indicating the coefficient range from 0.5 (dark blue) to 1.0 (light green). The map emphasizes regional variations in the measured metric.
### Components/Axes
- **Legend**: Positioned at the bottom, spanning the width of the map. It uses a continuous gradient from dark blue (0.5) to light green (1.0), labeled "DCCA coefficient [-]".
- **Countries**: Each country is shaded according to its DCCA coefficient value, with labels in the format `[ISO_CODE] [VALUE]` (e.g., `PRT 0.76`).
- **Geographic Context**: Europe is outlined with gray borders, and non-European regions (e.g., Russia, Turkey) are shaded gray without labels.
### Detailed Analysis
- **Country Values**:
- **Highest Values** (0.92–0.97):
- Luxembourg (LUX: 0.97), Denmark (DNK: 0.93), Poland (POL: 0.95), Germany (DEU: 0.97), France (FRA: 0.96), Ireland (IRL: 0.95), Sweden (SWE: 0.92), Estonia (EST: 0.92), Finland (FIN: 0.88), Italy (ITA: 0.86), Austria (AUT: 0.92), Hungary (HUN: 0.89), Czech Republic (CZE: 0.85).
- **Mid-Range Values** (0.85–0.91):
- Belgium (BEL: 0.90), Netherlands (NLD: 0.93), Switzerland (SUI: 0.87), Spain (ESP: 0.90), Portugal (PRT: 0.76), Bulgaria (BGR: 0.76), Cyprus (CYP: 0.69).
- **Lowest Values** (0.69–0.76):
- Portugal (PRT: 0.76), Bulgaria (BGR: 0.76), Cyprus (CYP: 0.69).
- **Color Consistency**:
- Dark blue (e.g., Portugal, Bulgaria) aligns with the legend’s lower end (0.5–0.7).
- Light green (e.g., France, Germany) matches the upper range (0.9–1.0).
### Key Observations
1. **Regional Disparities**: Northern and central Europe (e.g., Germany, France, Scandinavia) exhibit the highest DCCA coefficients, while southern and eastern regions (e.g., Portugal, Bulgaria, Cyprus) show the lowest.
2. **Outliers**: Luxembourg (0.97) and Denmark (0.93) stand out as the highest, while Cyprus (0.69) is the lowest.
3. **Trends**: A general east-west gradient is observed, with higher values in the west/north and lower values in the east/south.
### Interpretation
The DCCA coefficient likely quantifies a form of temporal or spatial correlation (e.g., economic activity, climate patterns, or infrastructure connectivity) across Europe. The map suggests:
- **Northern/Central Europe**: Stronger integration or synchronization in the measured variable, possibly due to dense transportation networks, economic interdependence, or shared policy frameworks (e.g., EU membership).
- **Southern/Eastern Europe**: Lower values may reflect geographic isolation, economic disparities, or differing developmental trajectories. For example, Cyprus’s low value (0.69) could stem from its island status and smaller economic scale.
- **Luxembourg’s Exception**: Its high value (0.97) may reflect its role as a financial hub with strong cross-border ties.
The map underscores regional heterogeneity in the DCCA metric, highlighting areas of potential focus for policy or research. Further analysis would be needed to determine the exact nature of the correlation (e.g., economic, climatic) and its drivers.