## Choropleth Map: DCCA Coefficient by Country
### Overview
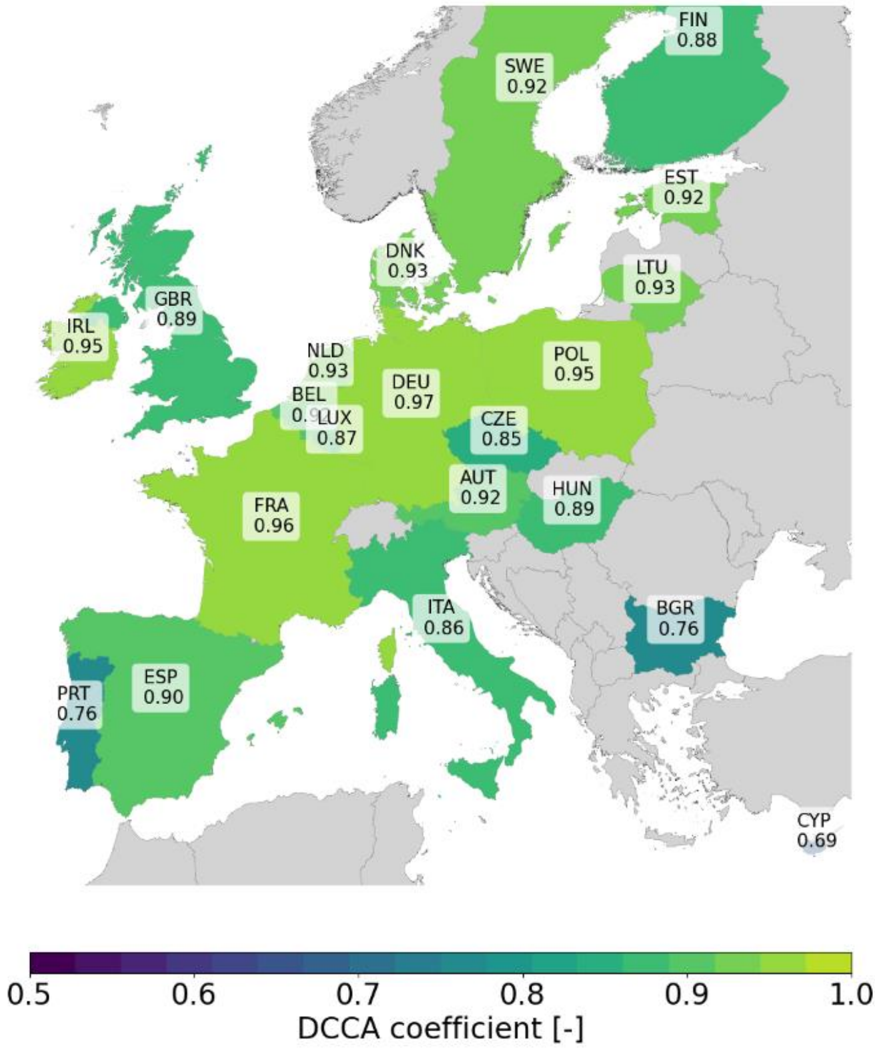
The image is a choropleth map of Europe, where countries are colored based on their DCCA (Detrended Cross-Correlation Analysis) coefficient. The color scale ranges from dark blue/purple (low values) to bright green/yellow (high values), as indicated by the colorbar at the bottom. Numerical values for each country are overlaid on the map.
### Components/Axes
* **Map:** Shows the geographical outline of Europe.
* **Countries:** Each country is labeled with its three-letter abbreviation (e.g., DEU for Germany, FRA for France) and a numerical value.
* **Colorbar:** Located at the bottom, it represents the DCCA coefficient scale, ranging from 0.5 to 1.0. The color gradient goes from dark blue/purple at 0.5 to bright green/yellow at 1.0.
* **Labels:** Country codes (e.g., IRL, GBR, PRT) and DCCA coefficient values are displayed on the map.
* **Units:** The DCCA coefficient is dimensionless, indicated by "[-]" in the colorbar label.
### Detailed Analysis or ### Content Details
Here's a breakdown of the DCCA coefficient for each country, based on the map and overlaid values:
* **Ireland (IRL):** 0.95
* **Great Britain (GBR):** 0.89
* **Portugal (PRT):** 0.76
* **Spain (ESP):** 0.90
* **France (FRA):** 0.96
* **Belgium (BEL) / Luxembourg (LUX):** 0.87
* **Netherlands (NLD):** 0.93
* **Denmark (DNK):** 0.93
* **Germany (DEU):** 0.97
* **Sweden (SWE):** 0.92
* **Finland (FIN):** 0.88
* **Estonia (EST):** 0.92
* **Lithuania (LTU):** 0.93
* **Poland (POL):** 0.95
* **Czech Republic (CZE):** 0.85
* **Austria (AUT):** 0.92
* **Hungary (HUN):** 0.89
* **Italy (ITA):** 0.86
* **Bulgaria (BGR):** 0.76
* **Cyprus (CYP):** 0.69
### Key Observations
* **High DCCA Coefficients:** Germany (0.97) and France (0.96) have the highest DCCA coefficients, indicated by their bright green/yellow color.
* **Low DCCA Coefficients:** Cyprus (0.69) and Bulgaria (0.76) have the lowest DCCA coefficients, indicated by their dark blue/purple color. Portugal also has a low coefficient of 0.76.
* **Geographical Trend:** There appears to be a general trend of higher DCCA coefficients in Central and Western Europe, with values decreasing towards the periphery (e.g., Southern and Eastern Europe).
* **Color Correlation:** The color of each country accurately reflects its DCCA coefficient value, as per the colorbar. For example, countries with values around 0.9 (e.g., Spain, Sweden) are colored in a light green shade.
### Interpretation
The choropleth map visualizes the DCCA coefficients across European countries. The DCCA coefficient likely represents a measure of correlation or similarity between some underlying data series for each country. Higher DCCA coefficients suggest a stronger correlation, while lower coefficients suggest a weaker correlation.
The map indicates that countries in Central and Western Europe exhibit stronger correlations compared to those in Southern and Eastern Europe. This could be due to various factors, such as economic integration, policy alignment, or shared environmental conditions. The specific meaning of the DCCA coefficient and the underlying data would be needed for a more detailed interpretation.
The map effectively communicates the spatial distribution of DCCA coefficients, allowing for easy comparison between countries and identification of regional patterns. The color gradient and overlaid values enhance the readability and interpretability of the map.