## Choropleth Map: DCCA Coefficient Across Europe
### Overview
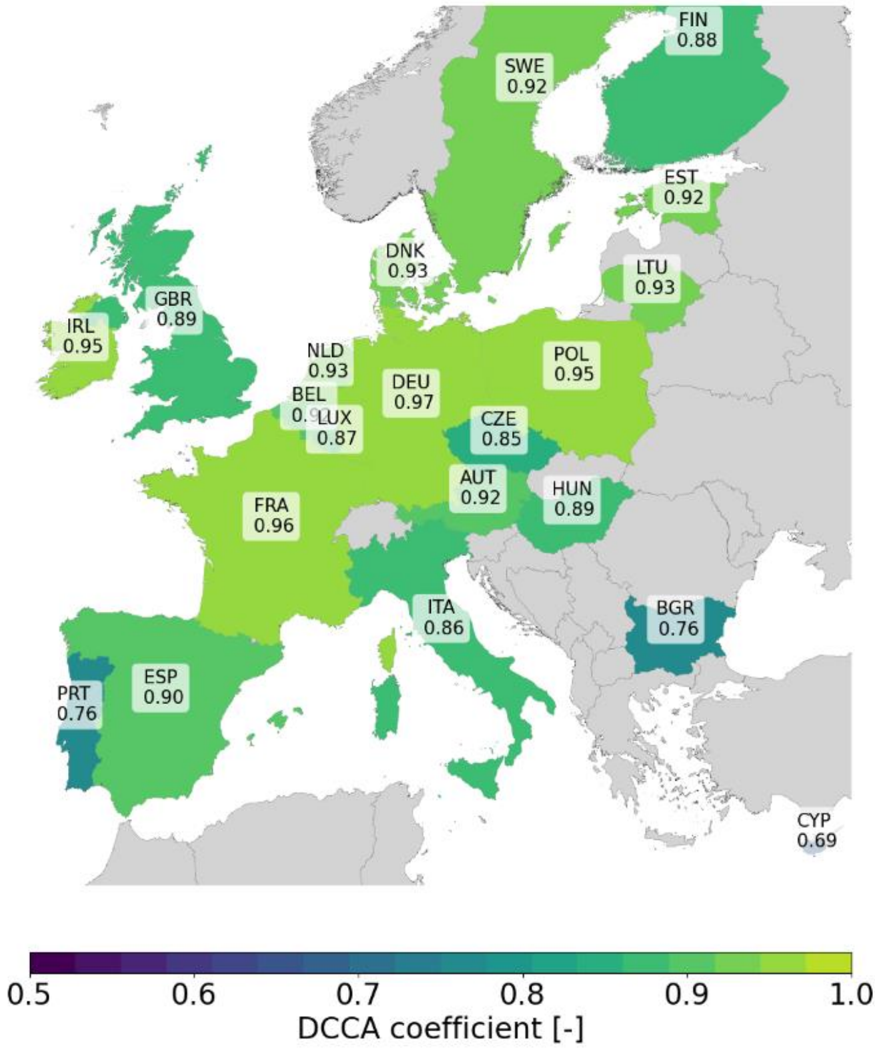
The image is a choropleth map of Europe, displaying the DCCA (Detrended Cross-Correlation Analysis) coefficient for various countries. The map uses a color gradient to represent the coefficient values, ranging from purple (low values) to green (high values). Countries are labeled with their three-letter ISO country codes and corresponding DCCA coefficient values. The map focuses on the European continent, with some surrounding areas included for geographical context.
### Components/Axes
* **Geographical Area:** Europe, with surrounding regions partially visible.
* **Color Scale:** Located at the bottom of the image, ranging from 0.5 (purple) to 1.0 (green). The scale is labeled "DCCA coefficient [-]".
* **Country Labels:** Each country is labeled with its three-letter ISO code and a numerical value representing the DCCA coefficient.
* **Countries Included:** AUT (Austria), BEL (Belgium),BGR (Bulgaria), CYP (Cyprus), CZE (Czech Republic), DEU (Germany), DNK (Denmark), ESP (Spain), EST (Estonia), FIN (Finland), FRA (France), GBR (United Kingdom), HUN (Hungary), IRL (Ireland), ITA (Italy), LTU (Lithuania), LUX (Luxembourg), NLD (Netherlands), POL (Poland), PRT (Portugal), SWE (Sweden).
### Detailed Analysis
The DCCA coefficients for each country are as follows (values are approximate, based on visual estimation):
* **BGR (Bulgaria):** 0.76
* **CYP (Cyprus):** 0.69
* **AUT (Austria):** 0.92
* **BEL (Belgium):** 0.87
* **CZE (Czech Republic):** 0.85
* **DEU (Germany):** 0.97
* **DNK (Denmark):** 0.93
* **ESP (Spain):** 0.90
* **EST (Estonia):** 0.92
* **FIN (Finland):** 0.88
* **FRA (France):** 0.96
* **GBR (United Kingdom):** 0.89
* **HUN (Hungary):** 0.89
* **IRL (Ireland):** 0.95
* **ITA (Italy):** 0.86
* **LTU (Lithuania):** 0.93
* **LUX (Luxembourg):** 0.87
* **NLD (Netherlands):** 0.93
* **POL (Poland):** 0.95
* **PRT (Portugal):** 0.76
* **SWE (Sweden):** 0.92
The color gradient shows that countries with values closer to 1.0 (green) have higher DCCA coefficients, while those closer to 0.5 (purple) have lower coefficients. The map shows a general trend of higher DCCA coefficients in Northern and Western Europe, with lower coefficients in Southern and Eastern Europe.
### Key Observations
* **Highest Values:** Germany (0.97) and France (0.96) exhibit the highest DCCA coefficients.
* **Lowest Values:** Bulgaria (0.76) and Cyprus (0.69) have the lowest DCCA coefficients.
* **Regional Trends:** Scandinavia (Sweden, Finland, Estonia) generally shows high values (around 0.88-0.92). The Iberian Peninsula (Spain, Portugal) shows relatively lower values (around 0.76-0.90).
* **Outliers:** Bulgaria and Cyprus stand out as having significantly lower DCCA coefficients compared to their neighboring countries.
### Interpretation
The map illustrates the spatial distribution of the DCCA coefficient across Europe. The DCCA coefficient is a measure of statistical dependence between two time series after removing trends. In this context, it likely represents the degree of similarity or correlation in some underlying process across different European countries.
The higher values in Western and Northern Europe could indicate a greater degree of synchronization or shared characteristics in the process being measured. The lower values in Southern and Eastern Europe might suggest less synchronization or different underlying dynamics. The outliers, Bulgaria and Cyprus, may be experiencing unique conditions or have different characteristics that lead to lower correlation with the rest of Europe.
Without knowing the specific time series being analyzed, it's difficult to provide a more precise interpretation. However, the map provides valuable insights into the spatial patterns of this statistical measure and suggests potential regional differences in the underlying process. The map is a visual representation of a complex statistical analysis, making it easier to identify patterns and trends that might not be apparent from raw data alone.