TECHNICAL ASSET FINGERPRINT
fb743fbf30a589bd3f8efc11
Click to view fullscreen
Press ESC or click to close
FOUND IN PAPERS
EXPERT: gemini-2.0-flash VERSION 1
RUNTIME: nugit/gemini/gemini-2.0-flash
INTEL_VERIFIED
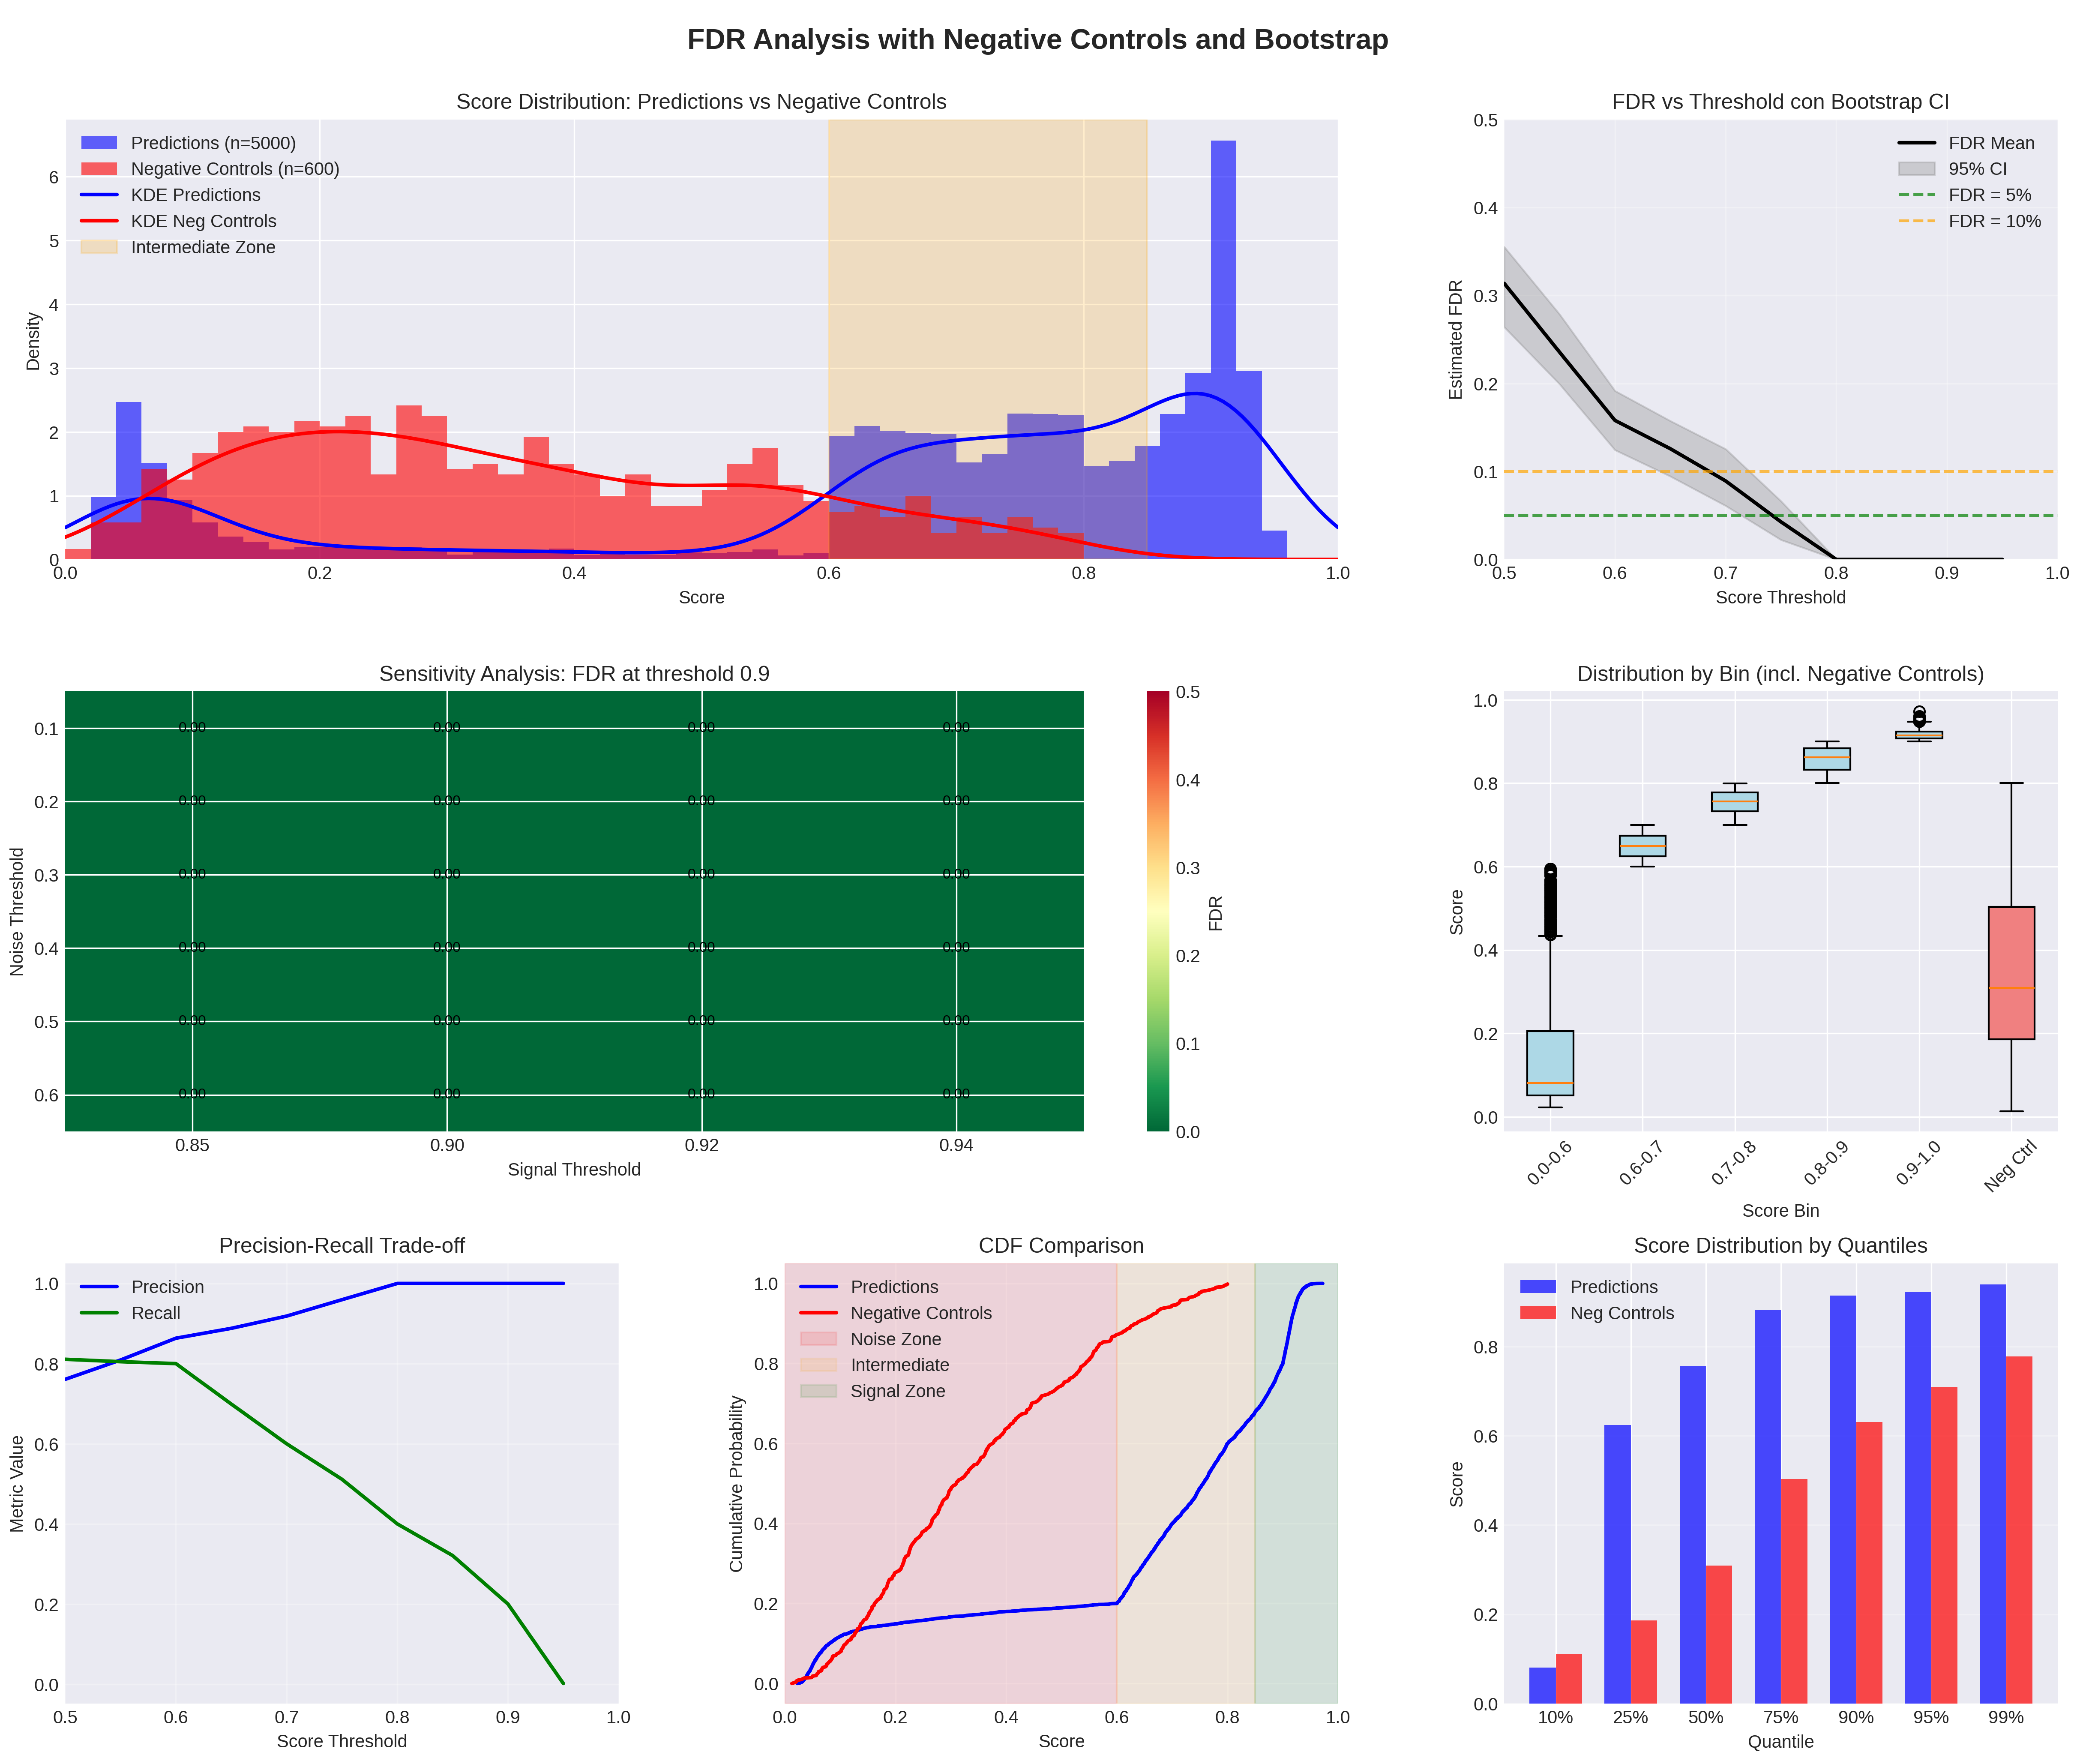
## FDR Analysis: Predictions vs Negative Controls and Bootstrap
### Overview
The image presents a comprehensive analysis of False Discovery Rate (FDR) using predictions and negative controls, incorporating bootstrap methods. It includes several plots illustrating score distributions, sensitivity analysis, precision-recall trade-offs, CDF comparisons, and score distributions by quantiles and bins.
### Components/Axes
**1. Score Distribution: Predictions vs Negative Controls**
* **Type**: Histogram with KDE (Kernel Density Estimate)
* **X-axis**: Score (0.0 to 1.0)
* **Y-axis**: Density (0 to 6)
* **Data**:
* Predictions (n=5000) - Blue histogram and KDE
* Negative Controls (n=600) - Red histogram and KDE
* **Zones**:
* Intermediate Zone - Light beige vertical band between approximately 0.6 and 0.8 on the x-axis.
**2. FDR vs Threshold con Bootstrap CI**
* **Type**: Line plot with confidence interval
* **X-axis**: Score Threshold (0.5 to 1.0)
* **Y-axis**: Estimated FDR (0.0 to 0.5)
* **Data**:
* FDR Mean - Black line
* 95% CI - Gray shaded area around the mean
* FDR = 5% - Green dashed horizontal line
* FDR = 10% - Orange dashed horizontal line
**3. Sensitivity Analysis: FDR at threshold 0.9**
* **Type**: Heatmap
* **X-axis**: Signal Threshold (0.85 to 0.94)
* **Y-axis**: Noise Threshold (0.0 to 0.6)
* **Color Scale**: FDR (0.0 to 0.5), ranging from dark green to red. All values appear to be dark green, indicating a low FDR.
**4. Distribution by Bin (incl. Negative Controls)**
* **Type**: Boxplot
* **X-axis**: Score Bin (0.0-0.6, 0.6-0.7, 0.7-0.8, 0.8-0.9, 0.9-1.0, Neg Ctrl)
* **Y-axis**: Score (0.0 to 1.0)
* **Data**: Boxplots showing the distribution of scores for each bin, including a separate boxplot for negative controls.
**5. Precision-Recall Trade-off**
* **Type**: Line plot
* **X-axis**: Score Threshold (0.5 to 1.0)
* **Y-axis**: Metric Value (0.0 to 1.0)
* **Data**:
* Precision - Blue line
* Recall - Green line
**6. CDF Comparison**
* **Type**: Line plot
* **X-axis**: Score (0.0 to 1.0)
* **Y-axis**: Cumulative Probability (0.0 to 1.0)
* **Data**:
* Predictions - Blue line
* Negative Controls - Red line
* **Zones**:
* Noise Zone - Light red vertical band from 0.0 to approximately 0.6 on the x-axis.
* Intermediate - Light beige vertical band from approximately 0.6 to 0.8 on the x-axis.
* Signal Zone - Light green vertical band from approximately 0.8 to 1.0 on the x-axis.
**7. Score Distribution by Quantiles**
* **Type**: Bar plot
* **X-axis**: Quantile (10%, 25%, 50%, 75%, 90%, 95%, 99%)
* **Y-axis**: Score (0.0 to 1.0)
* **Data**:
* Predictions - Blue bars
* Neg Controls - Red bars
### Detailed Analysis
**1. Score Distribution: Predictions vs Negative Controls**
* The blue histogram (Predictions) is skewed towards higher scores, peaking around 0.9-1.0. The KDE (blue line) confirms this trend.
* The red histogram (Negative Controls) is skewed towards lower scores, with a peak around 0.2. The KDE (red line) confirms this trend.
* The intermediate zone (0.6-0.8) shows an overlap between the two distributions.
**2. FDR vs Threshold con Bootstrap CI**
* The black line (FDR Mean) slopes downward as the score threshold increases.
* The gray area (95% CI) narrows as the score threshold increases.
* The FDR drops below 5% (green dashed line) at a score threshold of approximately 0.75.
* The FDR drops below 10% (orange dashed line) at a score threshold of approximately 0.65.
**3. Sensitivity Analysis: FDR at threshold 0.9**
* The heatmap is uniformly dark green, indicating a very low FDR across all combinations of signal and noise thresholds at a score threshold of 0.9. All values are approximately 0.0.
**4. Distribution by Bin (incl. Negative Controls)**
* The boxplots show an increasing median score as the score bin increases.
* The "Neg Ctrl" boxplot shows a lower median score compared to the other bins.
* The 0.0-0.6 bin has a median score around 0.1, with several outliers above 0.4.
* The 0.9-1.0 bin has a median score around 0.95.
* The Neg Ctrl bin has a median score around 0.3.
**5. Precision-Recall Trade-off**
* The blue line (Precision) generally increases with the score threshold, reaching 1.0 at a threshold of approximately 0.8.
* The green line (Recall) generally decreases with the score threshold, approaching 0.0 at a threshold of approximately 1.0.
**6. CDF Comparison**
* The red line (Negative Controls) rises more rapidly than the blue line (Predictions) for lower scores.
* The blue line (Predictions) rises sharply for higher scores, especially after 0.8.
* The noise zone (0.0-0.6) shows a higher cumulative probability for negative controls.
* The signal zone (0.8-1.0) shows a higher cumulative probability for predictions.
**7. Score Distribution by Quantiles**
* For all quantiles, the blue bars (Predictions) are higher than the red bars (Neg Controls).
* Both predictions and negative controls show increasing scores as the quantile increases.
* The difference between predictions and negative controls is most pronounced at higher quantiles.
### Key Observations
* Predictions tend to have higher scores than negative controls.
* Increasing the score threshold reduces the FDR but also reduces recall.
* A score threshold of 0.9 results in a very low FDR, according to the sensitivity analysis.
* The CDF comparison highlights the separation between predictions and negative controls across different score ranges.
### Interpretation
The data suggests that the predictions are well-separated from the negative controls, with predictions generally having higher scores. The FDR analysis indicates that a higher score threshold can be used to reduce the false discovery rate. However, this comes at the cost of reduced recall, as shown in the precision-recall trade-off. The CDF comparison provides a visual representation of the score distributions for predictions and negative controls, further supporting the conclusion that the two groups are distinct. The sensitivity analysis at a threshold of 0.9 confirms that a high threshold can effectively minimize the FDR. The distribution by bin and quantile plots provide additional insights into the score distributions across different categories.
DECODING INTELLIGENCE...