TECHNICAL ASSET FINGERPRINT
fb743fbf30a589bd3f8efc11
Click to view fullscreen
Press ESC or click to close
FOUND IN PAPERS
EXPERT: nemotron-free VERSION 1
RUNTIME: free/nvidia/nemotron-nano-12b-v2-vl:free
INTEL_VERIFIED
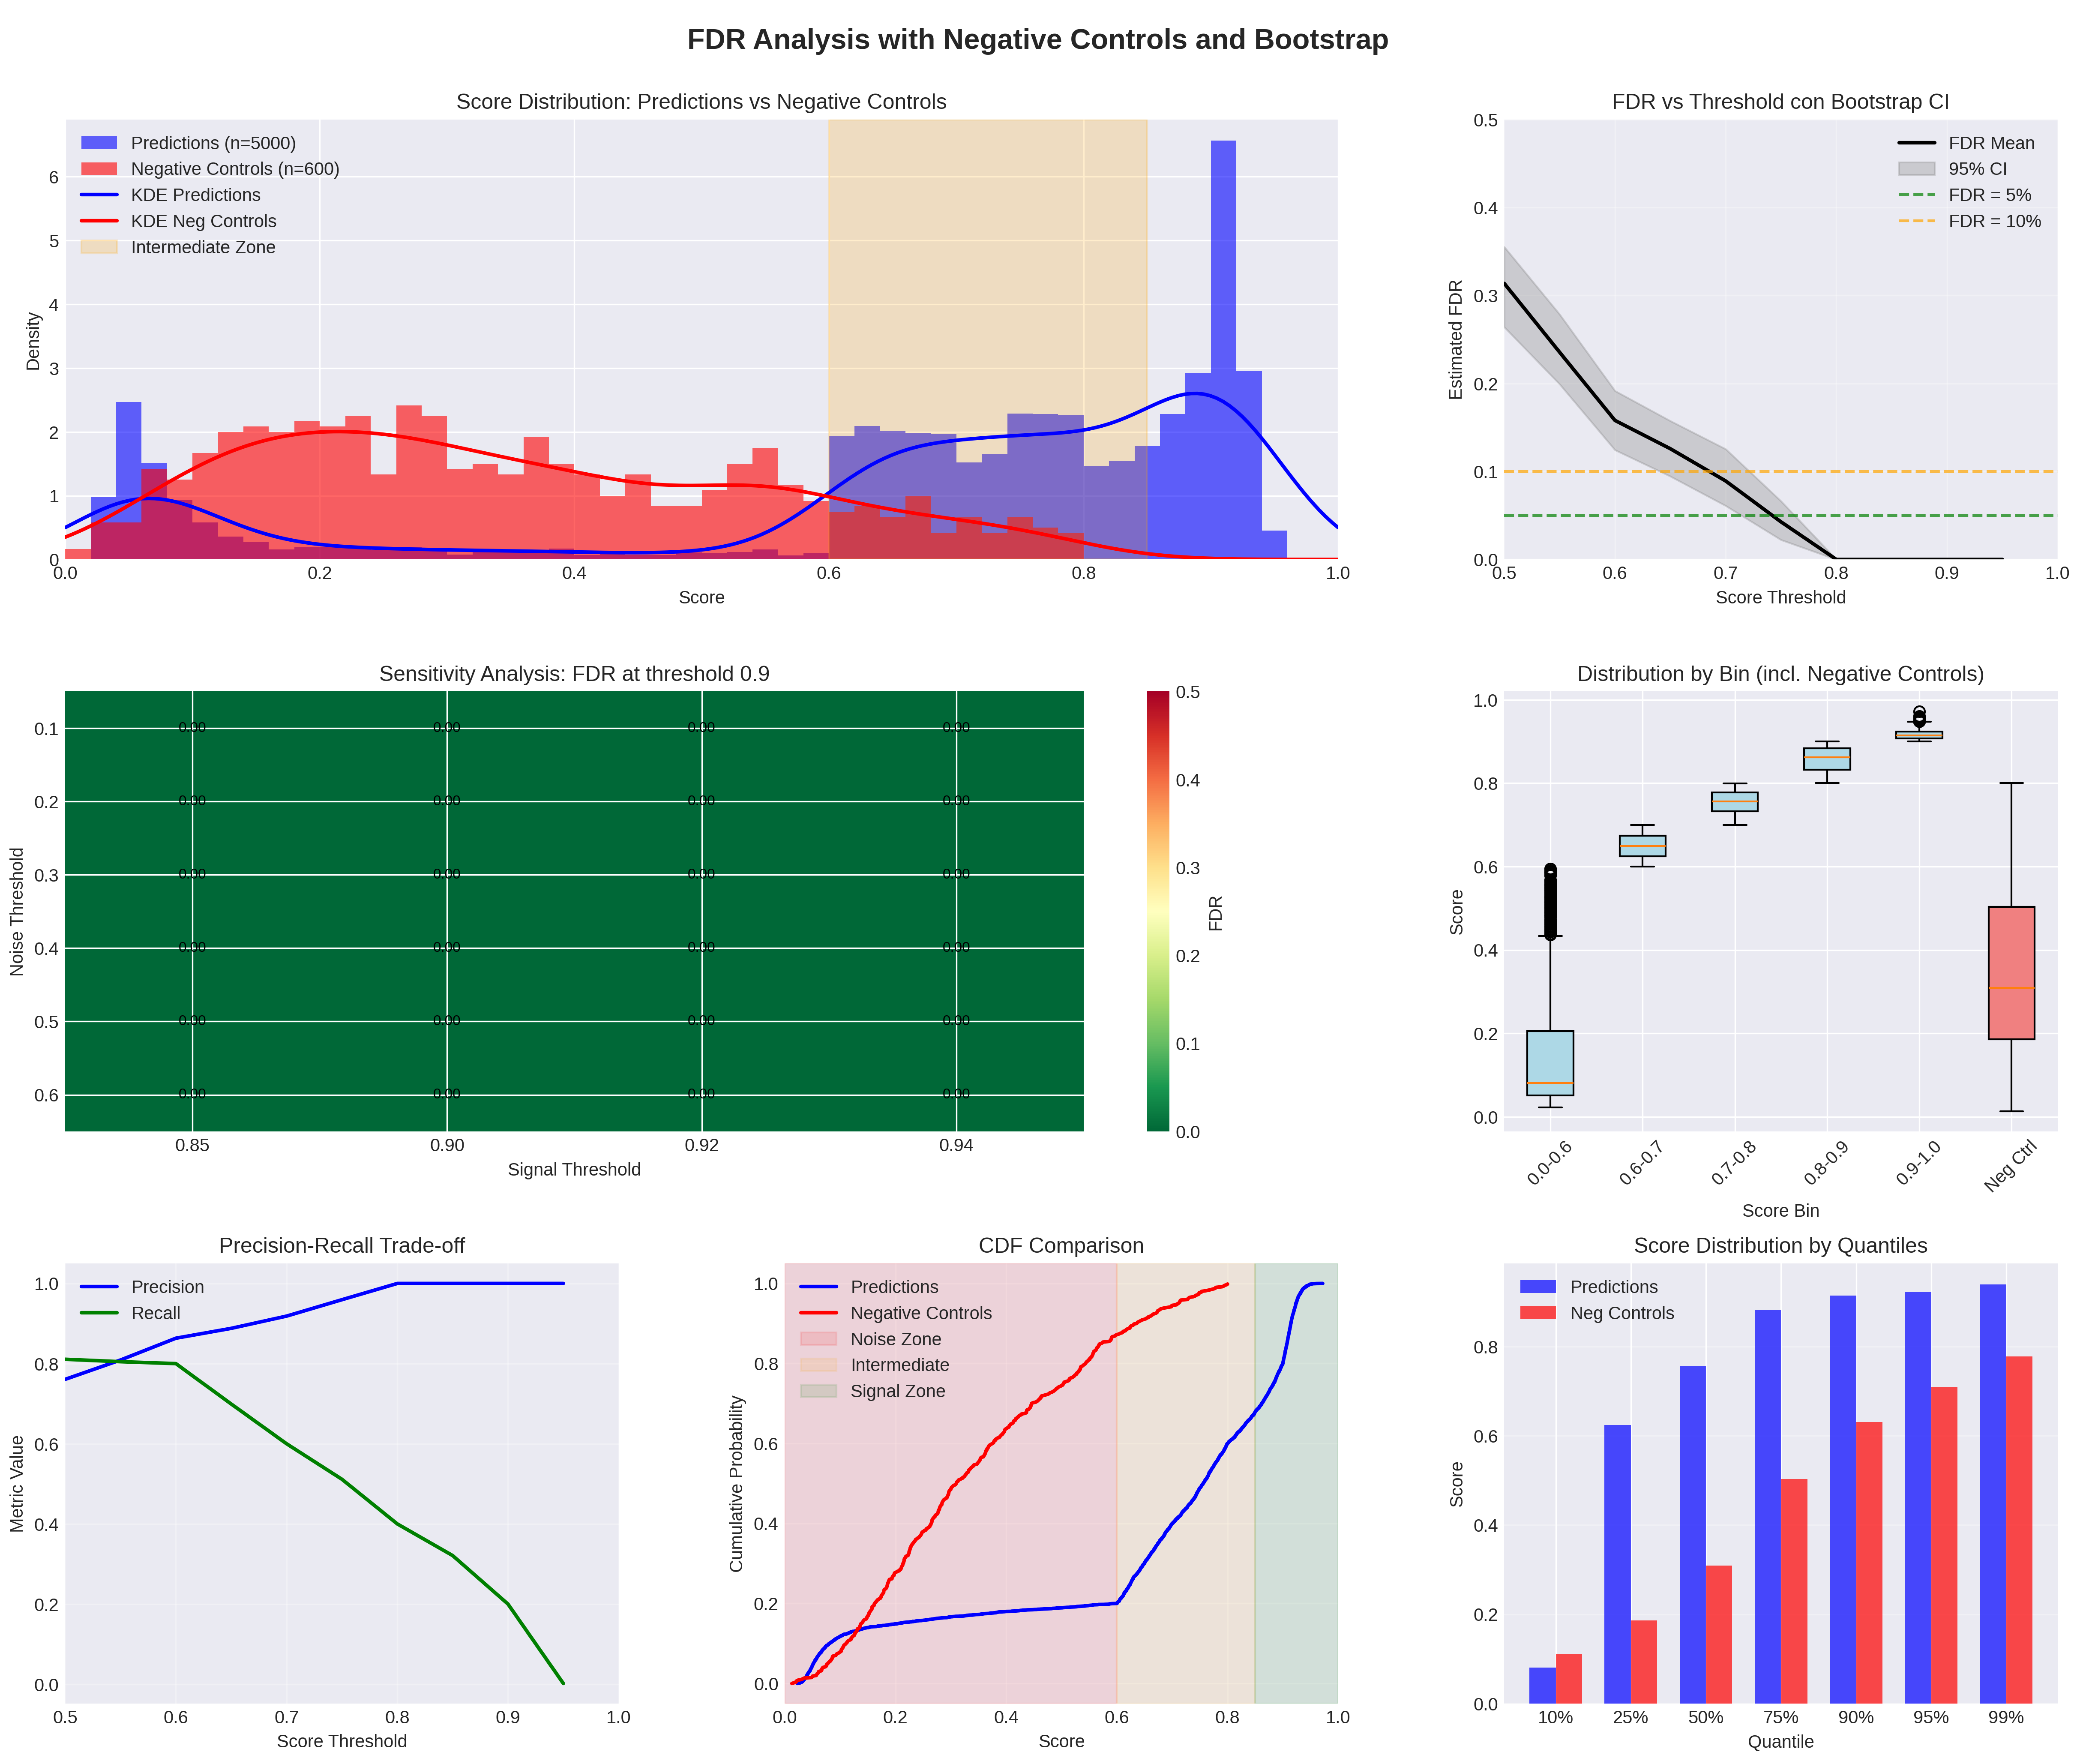
## Histogram: Score Distribution: Predictions vs Negative Controls
### Overview
A histogram comparing the score distributions of "Predictions" (blue) and "Negative Controls" (red), with a beige "Intermediate Zone" shaded between 0.6 and 0.8.
### Components/Axes
- **X-axis**: Score (0.0 to 1.0)
- **Y-axis**: Density (0 to 6)
- **Legend**:
- Blue: Predictions (n=5000)
- Red: Negative Controls (n=600)
- Beige: Intermediate Zone (0.6–0.8)
### Detailed Analysis
- **Predictions**: Peaks at ~0.9 with a density of ~2.5.
- **Negative Controls**: Peaks at ~0.2 with a density of ~2.
- **Intermediate Zone**: Shaded between 0.6 and 0.8, separating the two distributions.
### Key Observations
- Predictions are concentrated in higher score ranges (0.8–1.0), while Negative Controls cluster in lower ranges (0.0–0.4).
- The Intermediate Zone acts as a buffer between the two distributions.
### Interpretation
The separation suggests that Predictions are more likely to have high scores (potential true positives), while Negative Controls are lower-scoring (potential false positives). The Intermediate Zone may represent ambiguous cases requiring further validation.
---
## Line Plot: FDR vs Threshold con Bootstrap
### Overview
A line plot showing the estimated False Discovery Rate (FDR) as a function of the score threshold, with a 95% confidence interval (CI) and reference lines for FDR=5% and 10%.
### Components/Axes
- **X-axis**: Score Threshold (0.5 to 1.0)
- **Y-axis**: Estimated FDR (0 to 0.5)
- **Legend**:
- Black: FDR Mean
- Gray: 95% CI
- Green dashed: FDR=5%
- Orange dashed: FDR=10%
### Detailed Analysis
- The FDR Mean decreases monotonically as the threshold increases, dropping from ~0.3 at 0.5 to ~0.05 at 1.0.
- The 95% CI narrows significantly at higher thresholds (e.g., ~0.02 at 0.9 vs. ~0.1 at 0.6).
- The green dashed line (FDR=5%) is crossed at ~0.75, while the orange dashed line (FDR=10%) is crossed at ~0.65.
### Key Observations
- Higher thresholds reduce FDR, but the rate of improvement slows at thresholds >0.8.
- The 95% CI becomes tighter at higher thresholds, indicating more precise estimates.
### Interpretation
Increasing the score threshold reduces false positives, but the marginal gain diminishes beyond 0.8. The 5% FDR threshold is achieved at ~0.75, suggesting this is a practical balance between sensitivity and specificity.
---
## Heatmap: Sensitivity Analysis: FDR at threshold 0.9
### Overview
A heatmap showing FDR values at a fixed score threshold of 0.9 across varying noise thresholds.
### Components/Axes
- **X-axis**: Score Threshold (0.85–0.94)
- **Y-axis**: Noise Threshold (0.1–0.6)
- **Colorbar**: FDR (0.00–0.50)
### Detailed Analysis
- All cells are dark green, indicating FDR=0.00.
- No variation in FDR across noise thresholds or score thresholds near 0.9.
### Key Observations
- At threshold 0.9, FDR is consistently 0.00, regardless of noise level.
### Interpretation
A threshold of 0.9 eliminates false positives entirely, making it ideal for scenarios where minimizing FDR is critical, even with high noise.
---
## Box Plot: Distribution by Bin (incl. Negative Controls)
### Overview
Box plots comparing score distributions across bins, including Predictions (blue) and Negative Controls (red).
### Components/Axes
- **X-axis**: Score Bins (0.0–0.8, 0.6–0.7, 0.7–0.8, 0.8–0.9, 0.9–1.0, No Control)
- **Y-axis**: Score (0.0–1.0)
- **Legend**:
- Blue: Predictions
- Red: Negative Controls
### Detailed Analysis
- **Predictions**:
- Medians increase with higher bins (e.g., ~0.85 in 0.9–1.0).
- Outliers are rare in higher bins.
- **Negative Controls**:
- Medians are lower (e.g., ~0.3 in 0.0–0.8).
- Wider spread in the "No Control" bin (~0.4–0.6).
### Key Observations
- Predictions dominate higher score bins, while Negative Controls are concentrated in lower bins.
- The "No Control" bin shows overlap between Predictions and Negative Controls.
### Interpretation
Predictions are more likely to achieve high scores, suggesting better performance. Negative Controls exhibit variability, indicating potential false positives in lower-score ranges.
---
## Line Plot: Precision-Recall Trade-off
### Overview
A line plot comparing Precision (blue) and Recall (green) as functions of the score threshold.
### Components/Axes
- **X-axis**: Score Threshold (0.5–1.0)
- **Y-axis**: Metric Value (0.0–1.0)
- **Legend**:
- Blue: Precision
- Green: Recall
### Detailed Analysis
- **Precision**: Increases from ~0.8 at 0.5 to 1.0 at 1.0.
- **Recall**: Decreases from ~0.8 at 0.5 to 0.0 at 1.0.
- The lines intersect at ~0.7, where Precision=Recall.
### Key Observations
- Precision improves with higher thresholds, but Recall declines sharply.
- The trade-off is most pronounced above 0.7.
### Interpretation
Higher thresholds prioritize precision (fewer false positives) at the cost of recall (more false negatives). The optimal threshold depends on the application’s tolerance for false negatives.
---
## CDF Comparison: Predictions vs Negative Controls
### Overview
Cumulative Distribution Function (CDF) plots for Predictions (blue) and Negative Controls (red), with shaded zones for Noise, Intermediate, and Signal ranges.
### Components/Axes
- **X-axis**: Score (0.0–1.0)
- **Y-axis**: Cumulative Probability (0.0–1.0)
- **Legend**:
- Blue: Predictions
- Red: Negative Controls
- Pink: Noise Zone (0.0–0.6)
- Beige: Intermediate Zone (0.6–0.8)
- Green: Signal Zone (0.8–1.0)
### Detailed Analysis
- **Predictions**:
- CDF rises slowly below 0.8, then steeply after 0.8.
- ~90% of scores fall in the Signal Zone (0.8–1.0).
- **Negative Controls**:
- CDF rises gradually, with ~50% in the Noise Zone.
### Key Observations
- Predictions are concentrated in the Signal Zone, while Negative Controls are spread across Noise and Intermediate Zones.
### Interpretation
Predictions are more likely to belong to the Signal Zone, indicating higher relevance. Negative Controls are dispersed, suggesting they include both noise and ambiguous cases.
---
## Bar Chart: Score Distribution by Quantiles
### Overview
Bar chart comparing Predictions (blue) and Negative Controls (red) across score quantiles (10%–99%).
### Components/Axes
- **X-axis**: Quantiles (10%–99%)
- **Y-axis**: Score (0.0–1.0)
- **Legend**:
- Blue: Predictions
- Red: Negative Controls
### Detailed Analysis
- **Predictions**:
- Higher scores in all quantiles (e.g., ~0.95 in 99% bin).
- **Negative Controls**:
- Lower scores (e.g., ~0.5 in 99% bin).
### Key Observations
- Predictions consistently outperform Negative Controls across all quantiles.
- The gap widens in higher quantiles (e.g., 99% bin: Predictions ~0.95 vs. Negative Controls ~0.5).
### Interpretation
Predictions are more likely to achieve high scores, indicating superior performance. Negative Controls are limited to lower-score ranges, suggesting they are less discriminative.
---
## Line Plot: FDR Analysis with Negative Controls and Bootstrap
### Overview
A line plot showing FDR Mean and 95% CI as a function of the score threshold, with reference lines for FDR=5% and 10%.
### Components/Axes
- **X-axis**: Score Threshold (0.5–1.0)
- **Y-axis**: Estimated FDR (0.0–0.5)
- **Legend**:
- Black: FDR Mean
- Gray: 95% CI
- Green dashed: FDR=5%
- Orange dashed: FDR=10%
### Detailed Analysis
- The FDR Mean decreases from ~0.3 at 0.5 to ~0.05 at 1.0.
- The 95% CI narrows significantly at higher thresholds (e.g., ~0.02 at 0.9 vs. ~0.1 at 0.6).
- The green dashed line (FDR=5%) is crossed at ~0.75, while the orange dashed line (FDR=10%) is crossed at ~0.65.
### Key Observations
- Higher thresholds reduce FDR, but the rate of improvement slows at thresholds >0.8.
- The 95% CI becomes tighter at higher thresholds, indicating more precise estimates.
### Interpretation
Increasing the score threshold reduces false positives, but the marginal gain diminishes beyond 0.8. The 5% FDR threshold is achieved at ~0.75, suggesting this is a practical balance between sensitivity and specificity.
DECODING INTELLIGENCE...