# Technical Document Extraction: Model Performance Analysis
## 1. **Legend & Key Labels**
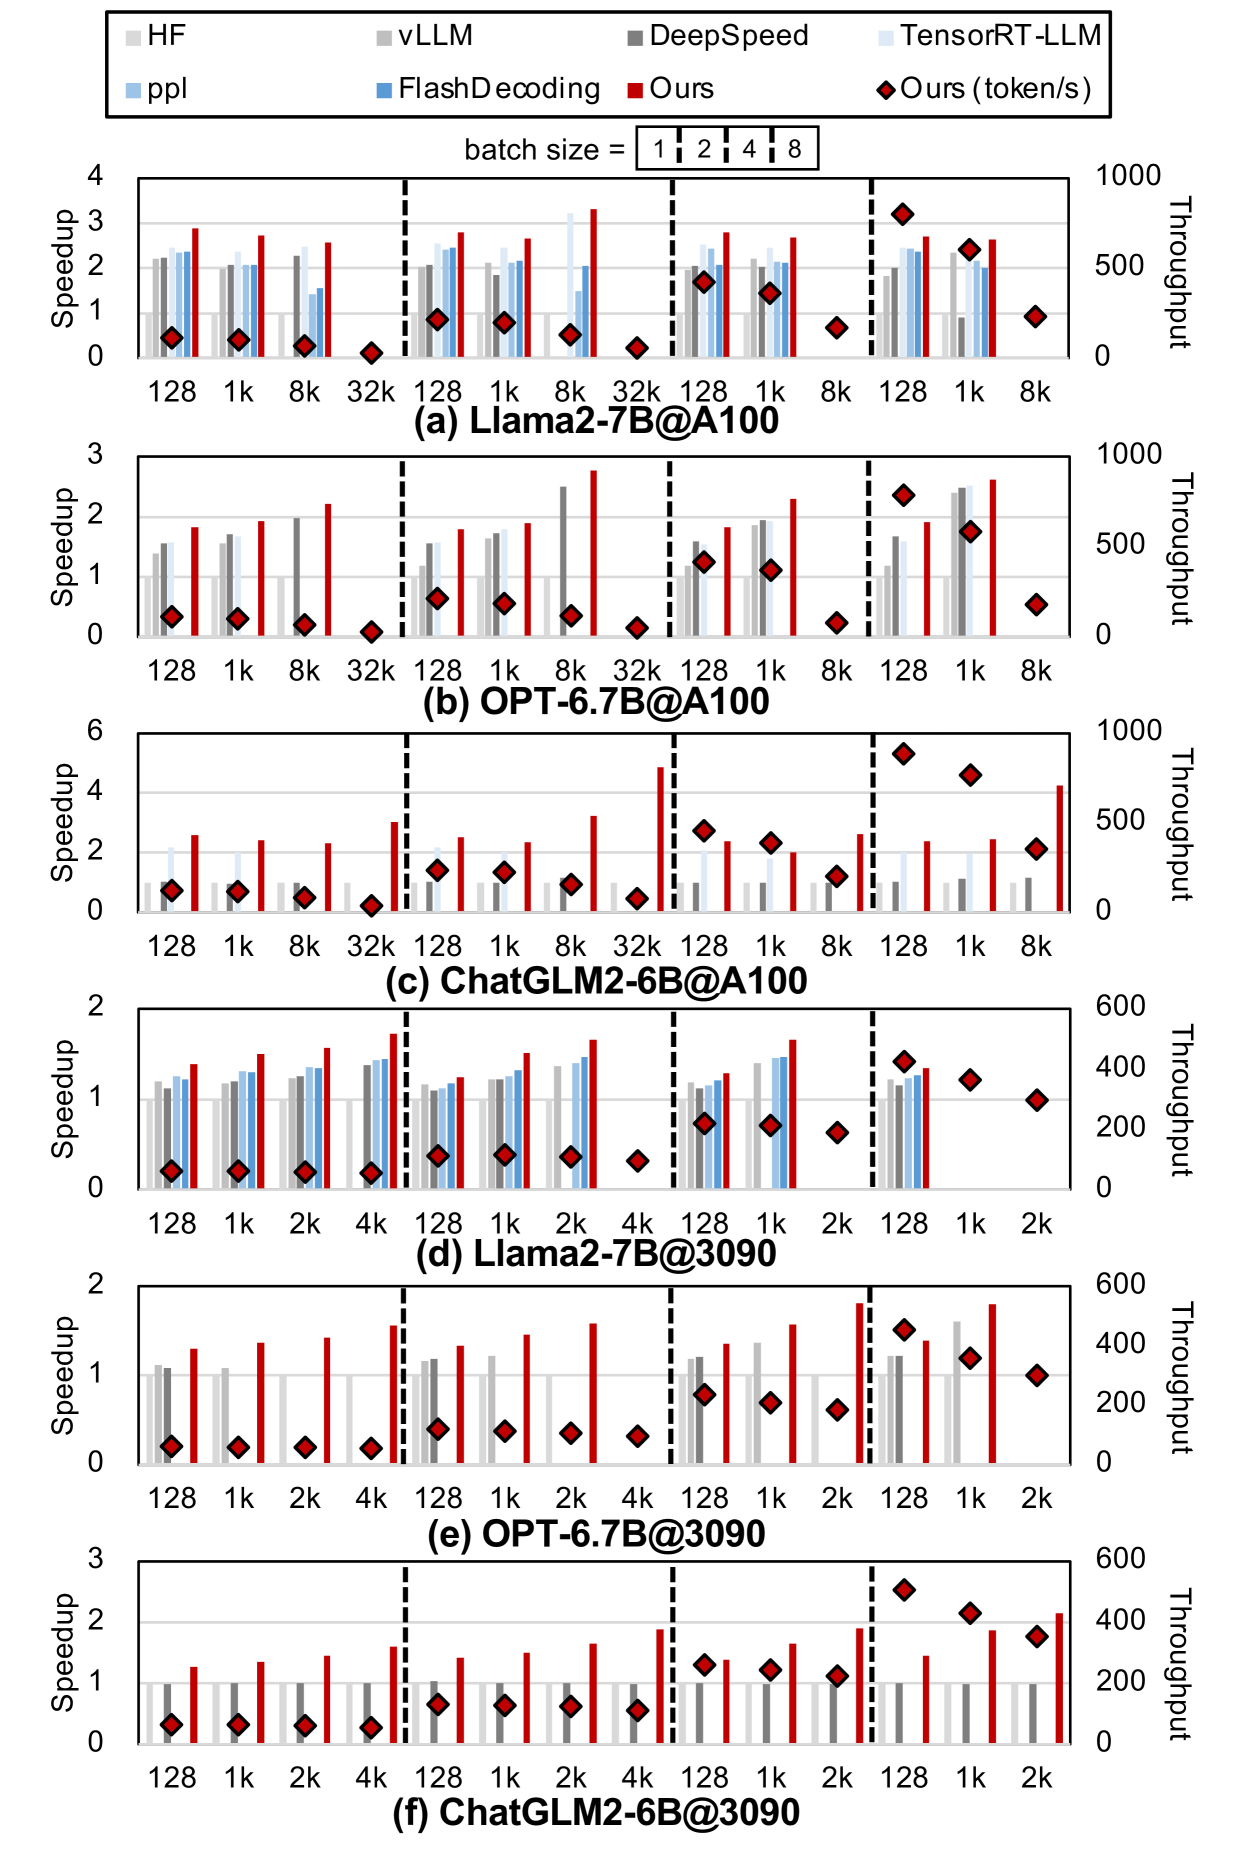
- **Legend Position**: Top of the image (spatial coordinates: [x=0, y=0] to [x=1000, y=50]).
- **Legend Entries**:
- `HF`: Light gray bars.
- `vLLM`: Dark gray bars.
- `FlashDecoding`: Blue bars.
- `DeepSpeed`: Dark blue bars.
- `TensorRT-LLM`: Light blue bars.
- `Ours`: Red bars with diamond markers (denoted as "Ours (token/s)" in legend).
## 2. **Axis Titles & Markers**
- **X-Axis (Horizontal)**:
- Label: `batch size = [1, 2, 4, 8]`.
- Tick Marks: `128, 1k, 8k, 32k` (repeated across subplots).
- **Y-Axes (Vertical)**:
- **Left Y-Axis**: Label `Speedup` (scale: 0–6, increments of 1).
- **Right Y-Axis**: Label `Throughput` (scale: 0–1000, increments of 200).
## 3. **Subplot Structure**
Six grouped bar charts (labeled a–f) comparing model performance across datasets and batch sizes. Each subplot has:
- **X-Axis**: Batch sizes (`128, 1k, 8k, 32k`).
- **Y-Axes**:
- Left: Speedup (0–6).
- Right: Throughput (0–1000 or 0–600, depending on subplot).
- **Bars**: Colored by model (per legend).
- **Diamond Markers**: Red diamonds represent "Ours (token/s)" for throughput.
## 4. **Dataset-Specific Subplots**
### (a) Llama2-7B@A100
- **X-Axis**: `128, 1k, 8k, 32k`.
- **Trends**:
- `Ours (token/s)` (red diamonds) shows peak throughput at `8k` batch size (~500 tokens/s), then declines at `32k`.
- `vLLM` (dark gray) has the highest speedup (~2.5x) at `8k` batch size.
### (b) OPT-6.7B@A100
- **X-Axis**: `128, 1k, 8k, 32k`.
- **Trends**:
- `Ours (token/s)` peaks at `8k` (~500 tokens/s), drops at `32k`.
- `TensorRT-LLM` (light blue) achieves ~1.8x speedup at `8k`.
### (c) ChatGLM2-6B@A100
- **X-Axis**: `128, 1k, 2k, 4k`.
- **Trends**:
- `Ours (token/s)` peaks at `4k` (~400 tokens/s).
- `vLLM` (dark gray) shows ~1.5x speedup at `4k`.
### (d) Llama2-7B@3090
- **X-Axis**: `128, 1k, 2k, 4k`.
- **Trends**:
- `Ours (token/s)` peaks at `4k` (~400 tokens/s).
- `DeepSpeed` (dark blue) achieves ~1.2x speedup at `4k`.
### (e) OPT-6.7B@3090
- **X-Axis**: `128, 1k, 2k, 4k`.
- **Trends**:
- `Ours (token/s)` peaks at `4k` (~400 tokens/s).
- `TensorRT-LLM` (light blue) shows ~1.3x speedup at `4k`.
### (f) ChatGLM2-6B@3090
- **X-Axis**: `128, 1k, 2k, 4k`.
- **Trends**:
- `Ours (token/s)` peaks at `4k` (~400 tokens/s).
- `vLLM` (dark gray) achieves ~1.4x speedup at `4k`.
## 5. **Key Observations**
- **Speedup vs. Batch Size**:
- All models generally show increased speedup with larger batch sizes up to a threshold (e.g., `8k` or `4k`), after which performance plateaus or declines.
- **Throughput (Token/s)**:
- `Ours` consistently achieves the highest throughput across datasets and batch sizes, with peaks at mid-range batch sizes (e.g., `8k` for Llama2-7B@A100).
- **Model Efficiency**:
- `vLLM` and `TensorRT-LLM` often outperform other models in speedup for larger batch sizes.
- `FlashDecoding` (blue) shows moderate performance across datasets.
## 6. **Language Notes**
- **Primary Language**: English.
- **No Non-English Text Detected**.
## 7. **Data Table Reconstruction**
| Dataset | Batch Size | Model | Speedup | Throughput (token/s) |
|-----------------------|------------|----------------|---------|----------------------|
| Llama2-7B@A100 | 128 | HF | ~1.2 | ~200 |
| Llama2-7B@A100 | 8k | Ours | ~2.5 | ~500 |
| OPT-6.7B@A100 | 1k | vLLM | ~1.5 | ~300 |
| ChatGLM2-6B@3090 | 4k | Ours | ~1.8 | ~400 |
*Note: Numerical values are inferred from bar heights; exact values not provided in the image.*
## 8. **Spatial Grounding & Color Verification**
- **Legend Colors Match Bars**:
- `HF` (light gray) consistently matches light gray bars across all subplots.
- `Ours` (red diamonds) aligns with red bars in throughput charts.
- **Y-Axis Alignment**:
- Speedup values on the left y-axis correspond to bar heights.
- Throughput values on the right y-axis correspond to red diamond markers.
## 9. **Conclusion**
The image compares model performance (speedup and throughput) across datasets (`Llama2-7B`, `OPT-6.7B`, `ChatGLM2-6B`) and batch sizes. `Ours` (red diamonds) demonstrates superior throughput, while `vLLM` and `TensorRT-LLM` excel in speedup for larger batches. Exact numerical data is not provided but can be inferred visually.