# Technical Document Extraction: 2D PCA of Embeddings (AlignVLM)
## 1. Document Metadata
* **Title:** 2D PCA of Embeddings (AlignVLM)
* **Type:** Principal Component Analysis (PCA) Scatter Plot
* **Language:** English
## 2. Component Isolation
### Header
* **Main Title:** "2D PCA of Embeddings (AlignVLM)"
### Main Chart Area
* **X-Axis Label:** "PC1" (Principal Component 1)
* **Y-Axis Label:** "PC2" (Principal Component 2)
* **X-Axis Scale:** Ranges from approximately -0.15 to +0.15. Major tick marks are visible at -0.15, -0.10, -0.05, 0.00, 0.05, 0.10, and 0.15.
* **Y-Axis Scale:** Ranges from approximately -0.10 to +0.10 (with data points extending slightly beyond to ~ -0.12 and +0.13). Major tick marks are visible at -0.10, -0.05, 0.00, 0.05, and 0.10.
* **Grid:** A standard rectangular grid is overlaid on the plot area.
### Legend [Spatial Grounding: Top-Left Corner]
* **Location:** Approximately [x=0.1, y=0.9] in normalized coordinates relative to the chart area.
* **Entry 1:** Light Blue Circle (semi-transparent) — "Other Embeddings"
* **Entry 2:** Red Circle (opaque) — "Most Influential Embeds in AlignVLM"
---
## 3. Data Analysis and Trends
### Trend Verification
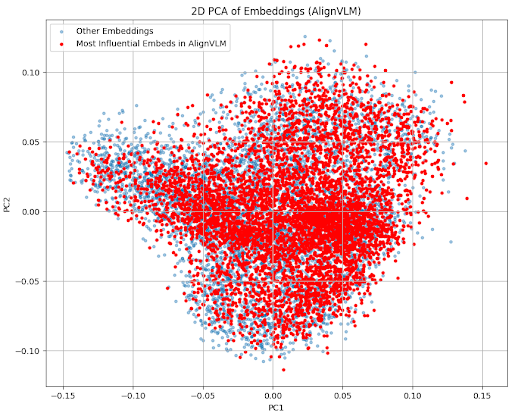
* **Other Embeddings (Light Blue):** This series forms the "background" distribution. It occupies a broad, roughly triangular or "arrowhead" shape pointing toward the left. The density is highest in the center-right and thins out significantly as PC1 decreases toward -0.15.
* **Most Influential Embeds (Red):** This series is overlaid on the blue distribution. It shows a high degree of overlap with the "Other Embeddings" but appears more concentrated in specific clusters, particularly in the central and right-hand regions of the plot (PC1 > -0.05).
### Spatial Distribution and Key Data Points
1. **Horizontal Spread (PC1):**
* The data spans from a minimum PC1 of roughly **-0.15** to a maximum of roughly **0.15**.
* The "Most Influential" (red) points are less frequent in the extreme left tail (PC1 < -0.10) compared to the "Other" (blue) points.
2. **Vertical Spread (PC2):**
* The data spans from a minimum PC2 of roughly **-0.12** to a maximum of roughly **0.13**.
* There is a noticeable "bulge" or higher density of red points in the upper-right quadrant (PC1: 0.0 to 0.10, PC2: 0.0 to 0.10).
3. **Central Cluster:**
* A dense horizontal band of red points is visible along the **PC2 = 0.0** line, stretching from PC1 = -0.05 to PC1 = 0.07. This suggests a significant portion of influential embeddings share similar characteristics along the second principal component.
4. **Outliers:**
* A few red points are isolated at the extreme right (PC1 ≈ 0.15).
* Blue points are the primary occupants of the far-left "nose" of the distribution (PC1 ≈ -0.15, PC2 ≈ 0.03).
---
## 4. Technical Summary
The visualization represents a dimensionality reduction of high-dimensional embedding vectors into a 2D space using PCA. The primary objective of the chart is to compare the distribution of "Most Influential" embeddings against the general population of "Other" embeddings within the AlignVLM model.
**Key Finding:** The "Most Influential" embeddings are not isolated in a separate cluster; rather, they are embedded within the general distribution but show higher density in the central and positive regions of PC1. This indicates that influence in the AlignVLM model is associated with specific features captured by the positive direction of the first principal component, while the "Other" embeddings are more widely dispersed, particularly into the negative PC1 space.