\n
## Scatter Plot: 2D PCA of Embeddings (AlignVLM)
### Overview
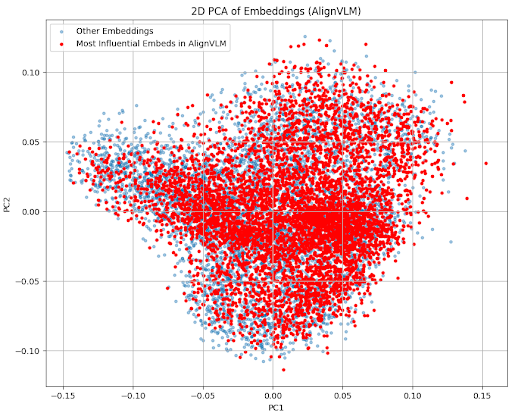
This image presents a scatter plot visualizing the 2-dimensional Principal Component Analysis (PCA) of embeddings generated by the AlignVLM model. The plot displays the distribution of embeddings across two principal components, PC1 and PC2, with different colors representing different categories of embeddings.
### Components/Axes
* **Title:** 2D PCA of Embeddings (AlignVLM) - positioned at the top-center of the image.
* **X-axis:** PC1 - ranges approximately from -0.15 to 0.15.
* **Y-axis:** PC2 - ranges approximately from -0.10 to 0.10.
* **Legend:** Located in the top-left corner.
* "Other Embeddings" - represented by light blue dots.
* "Most Influential Embeddings in AlignVLM" - represented by red dots.
* **Data Points:** Numerous dots scattered across the plot, representing individual embeddings.
### Detailed Analysis
The plot shows a clear separation between the two categories of embeddings.
* **"Other Embeddings" (Light Blue):** These points are distributed in a roughly elliptical shape centered around PC1 ≈ 0 and PC2 ≈ 0. The distribution is relatively spread out, covering a significant portion of the plot. There is a slight concentration of points in the lower-left quadrant (PC1 < 0, PC2 < 0) and upper-right quadrant (PC1 > 0, PC2 > 0).
* **"Most Influential Embeddings in AlignVLM" (Red):** These points form two distinct clusters.
* **Cluster 1:** Located around PC1 ≈ -0.07 and PC2 ≈ 0.02. This cluster is relatively compact.
* **Cluster 2:** Located around PC1 ≈ 0.07 and PC2 ≈ 0.02. This cluster is also relatively compact and roughly symmetrical to Cluster 1 with respect to the PC1 axis.
* There is a noticeable gap between the "Other Embeddings" and the "Most Influential Embeddings" clusters, particularly in the central region of the plot.
The density of red points is significantly higher than the density of blue points within their respective clusters.
### Key Observations
* The "Most Influential Embeddings" are clearly distinguishable from the "Other Embeddings" based on their PC1 and PC2 values.
* The "Most Influential Embeddings" are not uniformly distributed; they are concentrated in two distinct clusters.
* The "Other Embeddings" exhibit a broader distribution, suggesting greater variability.
* The separation suggests that the two categories of embeddings capture different aspects of the data or have different characteristics.
### Interpretation
The PCA plot suggests that the AlignVLM model identifies a subset of embeddings ("Most Influential Embeddings") that are significantly different from the rest ("Other Embeddings"). The two clusters of influential embeddings may represent distinct concepts or features that are particularly important for the model's performance. The clear separation indicates that the PCA effectively captures the underlying structure of the embeddings and highlights the key differences between these two groups. The fact that the influential embeddings are concentrated in clusters suggests that these concepts are not isolated but rather related to each other. This visualization could be used to understand which embeddings contribute most to the model's decision-making process and to identify potential areas for improvement. The model seems to be able to identify a subset of embeddings that are more important for its function.