# Technical Document Extraction: 2D PCA of Embeddings (AlignVLM)
## Title
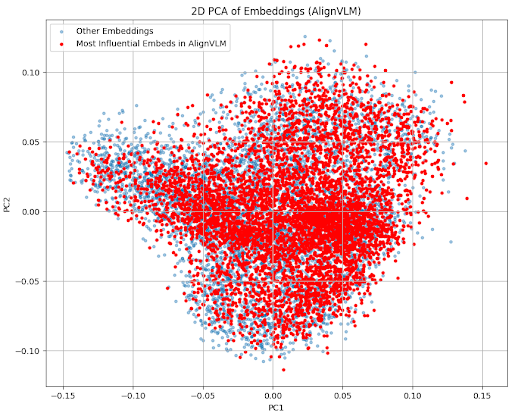
- **Title**: "2D PCA of Embeddings (AlignVLM)"
## Legend
- **Placement**: Top-right corner (inferred from standard chart conventions).
- **Labels**:
- **Blue**: "Other Embeddings"
- **Red**: "Most influential Embeds in AlignVLM"
## Axes
- **X-axis (PC1)**:
- Label: "PC1"
- Range: -0.15 to 0.15
- **Y-axis (PC2)**:
- Label: "PC2"
- Range: -0.15 to 0.15
## Data Series
### 1. "Most influential Embeds in AlignVLM" (Red)
- **Visual Trend**:
- Dense clustering in the central region of the plot (approximately PC1: -0.05 to 0.05, PC2: -0.05 to 0.05).
- Points exhibit a radial distribution with higher concentration near the origin.
- **Key Observations**:
- Dominates the central quadrant of the plot.
- No clear linear or directional trend; appears as a dispersed cluster.
### 2. "Other Embeddings" (Blue)
- **Visual Trend**:
- Scattered distribution across the entire plot, with a slight bias toward the upper-right quadrant (positive PC1 and PC2 values).
- Lower density compared to red points, with points spread more uniformly.
- **Key Observations**:
- No distinct clustering; points are dispersed.
- Overlaps with red points in the central region but less concentrated.
## Spatial Grounding
- **Legend**: Top-right corner (color-coded: blue for "Other Embeddings," red for "Most influential Embeds").
- **Data Point Verification**:
- Red points match the legend label "Most influential Embeds in AlignVLM."
- Blue points match the legend label "Other Embeddings."
## Trends and Analysis
- **Red Points (Most influential Embeds)**:
- Central clustering suggests these embeddings are more representative of the dataset's core structure.
- Lack of directional trend implies no strong linear relationship in the first two principal components.
- **Blue Points (Other Embeddings)**:
- Dispersed distribution indicates higher variability or noise in these embeddings.
- Slight upper-right bias may suggest a secondary trend or outlier population.
## Notes
- **No Additional Text**: The image contains no embedded text, tables, or sub-categories beyond the legend and axis labels.
- **Language**: All text is in English. No non-English content is present.
## Conclusion
The plot visualizes the distribution of embeddings in a 2D PCA space. The "Most influential Embeds in AlignVLM" (red) form a dense central cluster, while "Other Embeddings" (blue) are more dispersed. This suggests that the most influential embeddings are concentrated in a specific region of the PCA space, potentially indicating their critical role in the AlignVLM model's performance.