## Chart: Predictive Probability after One Failure
### Overview
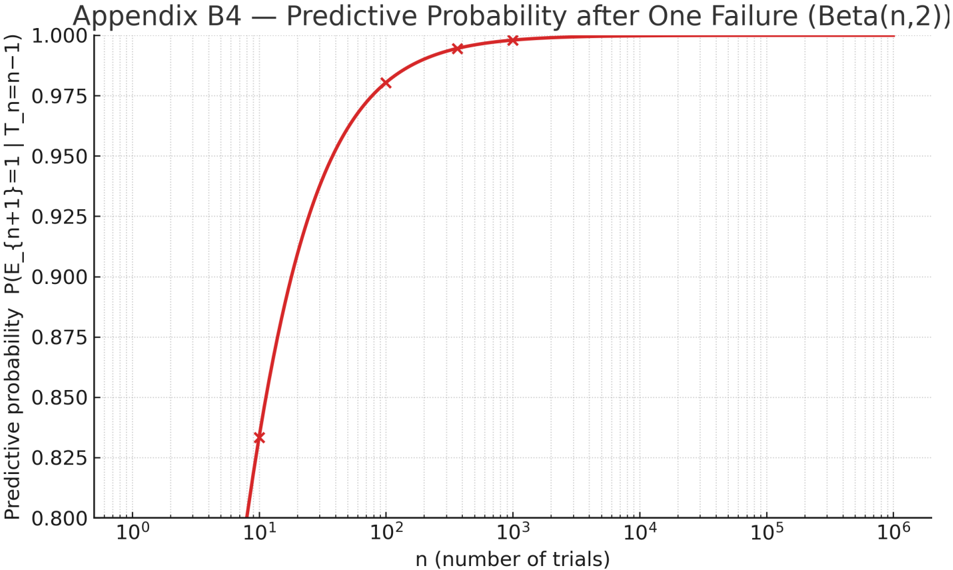
The image is a line chart showing the predictive probability after one failure as a function of the number of trials, n. The x-axis represents the number of trials on a logarithmic scale, ranging from 10^0 to 10^6. The y-axis represents the predictive probability, ranging from 0.800 to 1.000. The chart title is "Appendix B4 - Predictive Probability after One Failure (Beta(n,2))". The predictive probability increases rapidly with the number of trials and approaches 1.000.
### Components/Axes
* **Title:** Appendix B4 - Predictive Probability after One Failure (Beta(n,2))
* **X-axis:**
* Label: n (number of trials)
* Scale: Logarithmic (base 10)
* Markers: 10^0, 10^1, 10^2, 10^3, 10^4, 10^5, 10^6
* **Y-axis:**
* Label: Predictive probability P(E_{n+1}=1 | T_n=n-1)
* Scale: Linear
* Markers: 0.800, 0.825, 0.850, 0.875, 0.900, 0.925, 0.950, 0.975, 1.000
* **Data Series:**
* Red Line: Predictive Probability
### Detailed Analysis
The red line represents the predictive probability. The line starts at approximately (10^1, 0.83) and increases rapidly.
* At n = 10^1 (10 trials), the predictive probability is approximately 0.83.
* At n = 10^2 (100 trials), the predictive probability is approximately 0.97.
* At n = 10^3 (1000 trials), the predictive probability is approximately 0.99.
* At n = 10^4 (10000 trials), the predictive probability is approximately 0.998.
The line flattens out as it approaches 1.000.
### Key Observations
* The predictive probability increases rapidly with the number of trials.
* The predictive probability approaches 1.000 as the number of trials increases.
* The x-axis is on a logarithmic scale.
### Interpretation
The chart demonstrates that as the number of trials (n) increases, the predictive probability of success after one failure approaches 1. This suggests that with more data (more trials), the model becomes more confident in predicting future success, even after observing a failure. The Beta(n,2) distribution likely represents the prior belief about the probability of success, which is updated with the observed data (one failure). The rapid increase in predictive probability indicates that the model learns quickly from the data.