\n
## Chart: Predictive Probability after One Failure (Beta(n,2))
### Overview
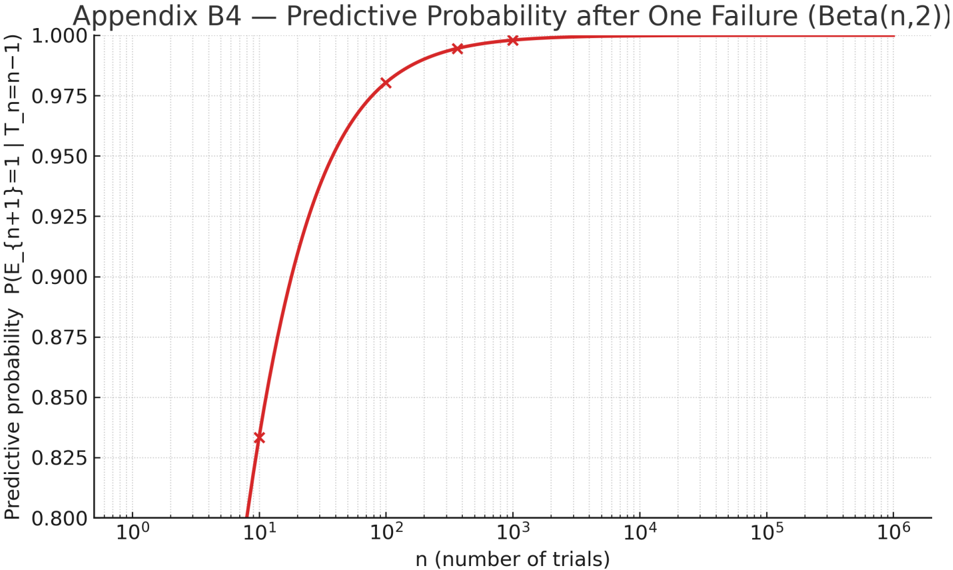
The image presents a line graph illustrating the predictive probability of an event given one failure, modeled by a Beta(n,2) distribution. The x-axis represents the number of trials ('n'), and the y-axis represents the predictive probability P(E_(n+1)=1 | T_n=n-1). The graph shows how the probability changes as the number of trials increases.
### Components/Axes
* **Title:** Appendix B4 – Predictive Probability after One Failure (Beta(n,2)) - positioned at the top-left.
* **X-axis Label:** n (number of trials) - positioned at the bottom-center. The scale is logarithmic, ranging from 10⁰ to 10⁶.
* **Y-axis Label:** Predictive probability P(E_(n+1)=1 | T_n=n-1) - positioned at the left-center. The scale ranges from 0.800 to 1.000.
* **Data Series:** A single red line representing the predictive probability.
* **Data Points:** Three distinct data points are marked with 'x' symbols on the line.
### Detailed Analysis
The red line representing the predictive probability starts at approximately 0.825 at n=10⁰ (n=1). It then rapidly increases, approaching 1.0 as 'n' increases. The line exhibits a steep positive slope initially, which gradually flattens out as 'n' grows larger.
Here are the approximate coordinates of the marked data points:
1. **Point 1:** n ≈ 10¹ (n=10), Predictive Probability ≈ 0.83
2. **Point 2:** n ≈ 10² (n=100), Predictive Probability ≈ 0.98
3. **Point 3:** n ≈ 10³ (n=1000), Predictive Probability ≈ 0.998
The line continues to approach 1.0, but does not appear to reach it within the displayed range of the x-axis.
### Key Observations
* The predictive probability increases rapidly with the number of trials.
* The rate of increase diminishes as the number of trials becomes larger.
* The probability approaches 1.0 asymptotically.
* The initial probability is relatively low (around 0.83) for a small number of trials.
### Interpretation
This chart demonstrates the Bayesian updating of belief in the probability of an event after observing one failure. The Beta(n,2) distribution is a common prior for modeling probabilities. As the number of trials ('n') increases, the observed data (one failure) has less influence on the posterior predictive probability, and the probability converges towards 1.0. This indicates that with more evidence, the initial uncertainty is reduced, and the belief in the event occurring becomes stronger. The initial low probability suggests a prior belief that the event is unlikely, but this belief is quickly updated as more trials are conducted. The asymptotic approach to 1.0 implies that even with a single failure, the probability of success in the next trial becomes very high as the number of trials increases. This is a typical behavior in Bayesian inference, where prior beliefs are updated by observed data.