TECHNICAL ASSET FINGERPRINT
fb96ae5186028dcae2674737
Click to view fullscreen
Press ESC or click to close
FOUND IN PAPERS
EXPERT: gemma-3-27b-it-free VERSION 1
RUNTIME: google-free/gemma-3-27b-it
INTEL_VERIFIED
## Heatmap: LLM Evaluation by Error Category
### Overview
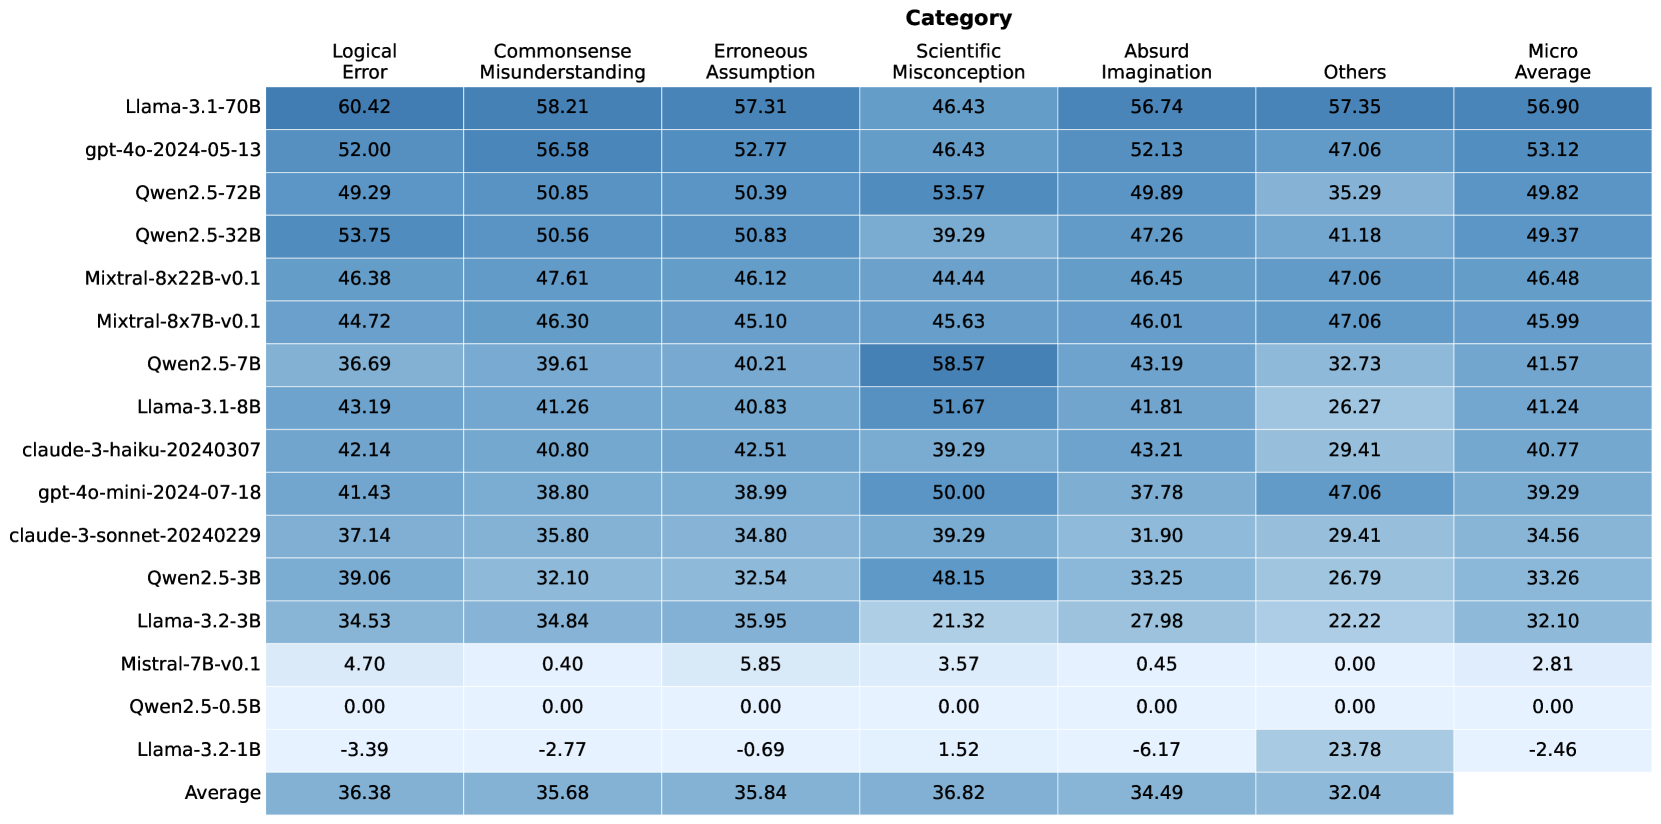
This heatmap visualizes the performance of various Large Language Models (LLMs) across six error categories, plus a "Micro Average" score. The color intensity represents the magnitude of the score, with darker shades indicating higher values. The LLMs are listed vertically on the y-axis, and the error categories are listed horizontally on the x-axis.
### Components/Axes
* **Y-axis (LLMs):** Llama-3-70B, gpt-4o-2024-05-13, Qwen2.5-72B, Qwen2.5-32B, Mixtral-8x22B-v0.1, Mixtral-8x7B-v0.1, Owen2.5-7B, Llama-3-18B, claude-3-haiku-20240307, gpt-4o-mini-2024-07-18, claude-3-sonnet-20240229, Qwen2.5-13B, Llama-2-70B, Meta-Llama-2-13B, Zephyr-7B-beta, Mistral-7B-Instruct-v0.1, OpenHermes-2.5-Mistral-7B
* **X-axis (Error Categories):** Logical Error, Commonsense Misunderstanding, Erroneous Assumption, Scientific Misconception, Absurd Imagination, Others, Micro Average
* **Color Scale:** The heatmap uses a gradient color scheme. The exact scale isn't provided, but darker colors represent higher values, and lighter colors represent lower values.
* **Legend:** No explicit legend is present, but the column headers define the categories.
### Detailed Analysis
Here's a breakdown of the data, reading across rows (LLM performance) and columns (error categories). Values are approximate, based on visual estimation.
* **Llama-3-70B:** Logical Error: 60.42, Commonsense Misunderstanding: 58.21, Erroneous Assumption: 57.31, Scientific Misconception: 46.43, Absurd Imagination: 56.74, Others: 57.35, Micro Average: 56.90
* **gpt-4o-2024-05-13:** Logical Error: 52.00, Commonsense Misunderstanding: 56.58, Erroneous Assumption: 52.77, Scientific Misconception: 46.43, Absurd Imagination: 52.13, Others: 47.06, Micro Average: 53.12
* **Qwen2.5-72B:** Logical Error: 49.29, Commonsense Misunderstanding: 50.85, Erroneous Assumption: 50.39, Scientific Misconception: 53.57, Absurd Imagination: 49.89, Others: 35.29, Micro Average: 49.82
* **Qwen2.5-32B:** Logical Error: 53.75, Commonsense Misunderstanding: 50.56, Erroneous Assumption: 50.83, Scientific Misconception: 39.29, Absurd Imagination: 47.26, Others: 41.18, Micro Average: 49.37
* **Mixtral-8x22B-v0.1:** Logical Error: 46.38, Commonsense Misunderstanding: 47.61, Erroneous Assumption: 46.12, Scientific Misconception: 44.44, Absurd Imagination: 46.45, Others: 47.06, Micro Average: 46.48
* **Mixtral-8x7B-v0.1:** Logical Error: 44.72, Commonsense Misunderstanding: 46.30, Erroneous Assumption: 45.10, Scientific Misconception: 45.63, Absurd Imagination: 46.01, Others: 47.06, Micro Average: 45.99
* **Owen2.5-7B:** Logical Error: 36.69, Commonsense Misunderstanding: 39.61, Erroneous Assumption: 40.21, Scientific Misconception: 58.57, Absurd Imagination: 43.19, Others: 32.73, Micro Average: 41.57
* **Llama-3-18B:** Logical Error: 43.19, Commonsense Misunderstanding: 41.26, Erroneous Assumption: 40.83, Scientific Misconception: 51.67, Absurd Imagination: 41.81, Others: 26.27, Micro Average: 41.24
* **claude-3-haiku-20240307:** Logical Error: 42.14, Commonsense Misunderstanding: 40.80, Erroneous Assumption: 42.51, Scientific Misconception: 39.29, Absurd Imagination: 43.21, Others: 29.41, Micro Average: 40.77
* **gpt-4o-mini-2024-07-18:** Logical Error: 41.43, Commonsense Misunderstanding: 38.80, Erroneous Assumption: 38.99, Scientific Misconception: 50.00, Absurd Imagination: 37.78, Others: 47.06, Micro Average: 39.29
* **claude-3-sonnet-20240229:** Logical Error: 37.14, Commonsense Misunderstanding: 35.80, Erroneous Assumption: 34.80, Scientific Misconception: 39.29, Absurd Imagination: 31.90, Others: 29.41, Micro Average: 34.56
* **Qwen2.5-13B:** Logical Error: 39.06, Commonsense Misunderstanding: 32.10, Erroneous Assumption: 32.54, Scientific Misconception: 48.15, Absurd Imagination: 33.25, Others: 26.79, Micro Average: 33.26
* **Llama-2-70B:** Logical Error: 34.45, Commonsense Misunderstanding: 30.94, Erroneous Assumption: 31.83, Scientific Misconception: 31.52, Absurd Imagination: 29.02, Others: 22.19, Micro Average: 31.00
* **Meta-Llama-2-13B:** Logical Error: 4.00, Commonsense Misunderstanding: 0.94, Erroneous Assumption: 0.83, Scientific Misconception: 2.37, Absurd Imagination: 0.96, Others: 0.00, Micro Average: 1.62
* **Zephyr-7B-beta:** Logical Error: 0.97, Commonsense Misunderstanding: 0.85, Erroneous Assumption: 0.95, Scientific Misconception: 2.04, Absurd Imagination: 0.99, Others: 0.00, Micro Average: 0.95
* **Mistral-7B-Instruct-v0.1:** Logical Error: 0.89, Commonsense Misunderstanding: 0.71, Erroneous Assumption: 0.79, Scientific Misconception: 1.85, Absurd Imagination: 0.81, Others: 0.00, Micro Average: 0.81
* **OpenHermes-2.5-Mistral-7B:** Logical Error: 0.83, Commonsense Misunderstanding: 0.77, Erroneous Assumption: 0.76, Scientific Misconception: 1.82, Absurd Imagination: 0.85, Others: 0.00, Micro Average: 0.81
### Key Observations
* **Llama-3-70B** consistently scores highest across most error categories.
* **Meta-Llama-2-13B, Zephyr-7B-beta, Mistral-7B-Instruct-v0.1, and OpenHermes-2.5-Mistral-7B** have very low scores across all categories, indicating strong performance.
* **Owen2.5-7B** shows a relatively high score in "Scientific Misconception" compared to other categories for that model.
* The "Others" category generally has lower scores than the more specific error types.
* There's a clear separation in performance between the larger models (Llama-3-70B, gpt-4o-2024-05-13, Qwen2.5-72B) and the smaller models (Meta-Llama-2-13B, Zephyr-7B-beta, etc.).
### Interpretation
This heatmap provides a comparative evaluation of LLMs based on their propensity to make different types of errors. The data suggests that larger models like Llama-3-70B exhibit better overall performance, making fewer errors across a wider range of categories. The lower scores of models like Meta-Llama-2-13B indicate they are more robust and less prone to these specific error types.
The variation in scores across error categories for each model highlights specific strengths and weaknesses. For example, a model might perform well on "Logical Error" but struggle with "Scientific Misconception," suggesting a need for further training or refinement in that area.
The "Micro Average" provides a single metric for overall performance, but it's important to consider the individual category scores to gain a more nuanced understanding of each model's capabilities. The heatmap allows for a quick visual identification of models that excel in certain areas and those that require improvement. The data suggests a trade-off between model size and performance, with larger models generally achieving higher accuracy but potentially requiring more computational resources.
DECODING INTELLIGENCE...