TECHNICAL ASSET FINGERPRINT
fb96ae5186028dcae2674737
Click to view fullscreen
Press ESC or click to close
FOUND IN PAPERS
EXPERT: healer-alpha-free VERSION 1
RUNTIME: free/openrouter/healer-alpha
INTEL_VERIFIED
## Table: Language Model Performance Across Error Categories
### Overview
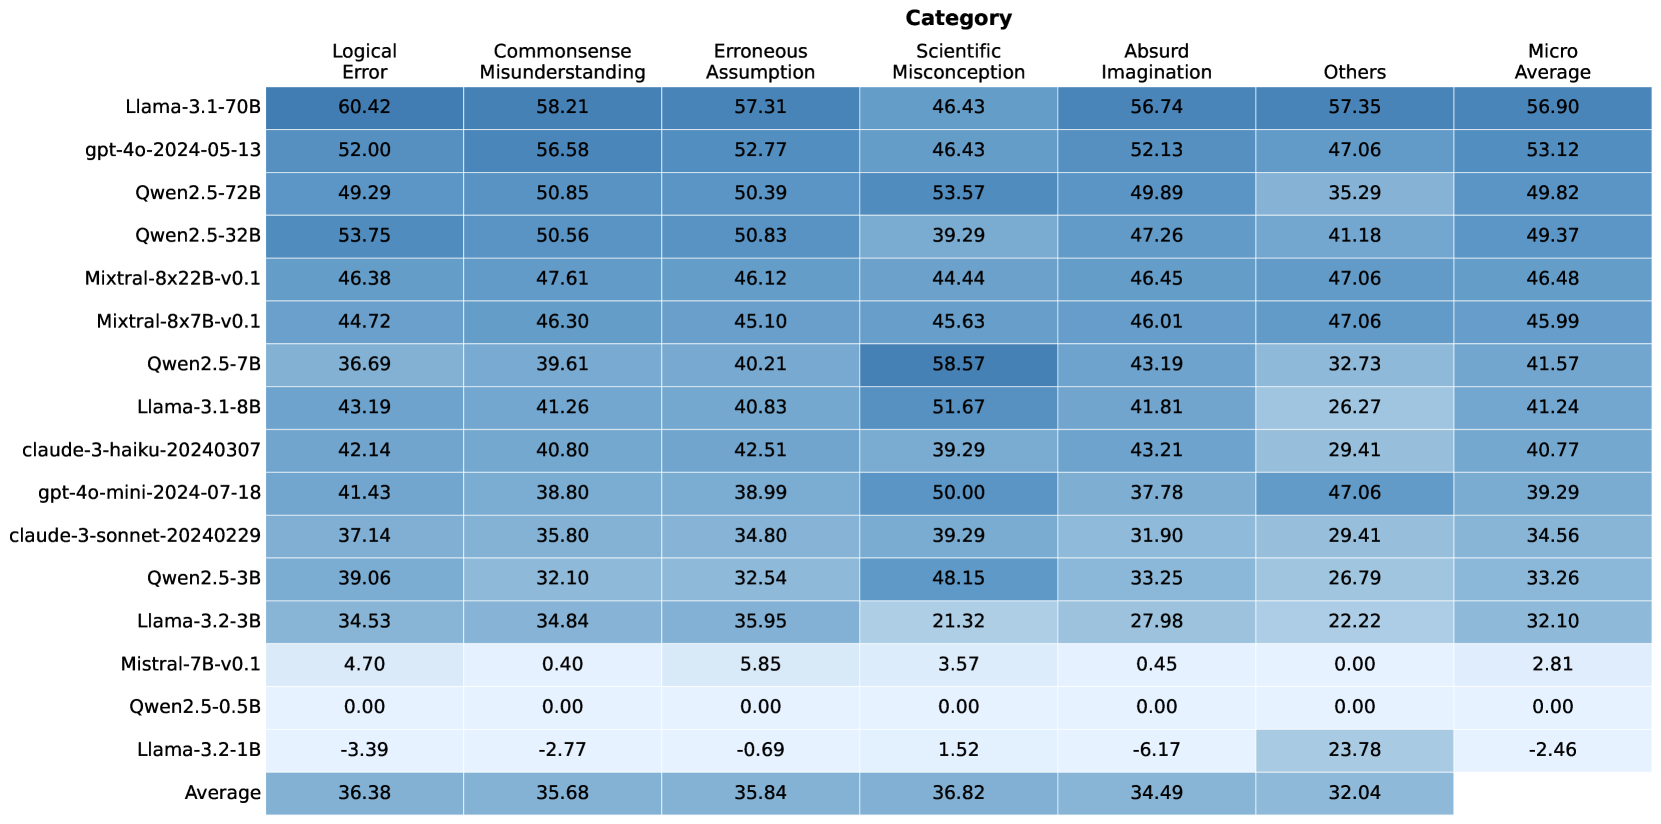
The image displays a heatmap-style table comparing the performance of 15 different large language models (LLMs) across six specific error categories and a micro-average. The performance metric is numerical, with higher values (indicated by darker blue shading) representing better performance or a higher score in mitigating that type of error. The table includes a final row showing the average score for each category across all models.
### Components/Axes
* **Rows (Models):** 15 distinct LLMs are listed vertically on the left side. The models are, from top to bottom:
1. Llama-3.1-70B
2. gpt-4o-2024-05-13
3. Qwen2.5-72B
4. Qwen2.5-32B
5. Mixtral-8x22B-v0.1
6. Mixtral-8x7B-v0.1
7. Qwen2.5-7B
8. Llama-3.1-8B
9. claude-3-haiku-20240307
10. gpt-4o-mini-2024-07-18
11. claude-3-sonnet-20240229
12. Qwen2.5-3B
13. Llama-3.2-3B
14. Mistral-7B-v0.1
15. Qwen2.5-0.5B
16. Llama-3.2-1B
17. Average (This is a summary row, not a model)
* **Columns (Error Categories):** Seven categories are listed horizontally across the top. From left to right:
1. Logical Error
2. Commonsense Misunderstanding
3. Erroneous Assumption
4. Scientific Misconception
5. Absurd Imagination
6. Others
7. Micro Average
* **Data Cells:** Each cell contains a numerical value (to two decimal places) representing the model's score for that category. The background color of each cell is a shade of blue, with darker shades corresponding to higher numerical values, creating a visual heatmap effect.
* **Spatial Layout:** The category headers are centered at the top. Model names are left-aligned. The numerical data is centered within each cell. The "Average" row is at the very bottom.
### Detailed Analysis
**Complete Data Table Reconstruction:**
| Model | Logical Error | Commonsense Misunderstanding | Erroneous Assumption | Scientific Misconception | Absurd Imagination | Others | Micro Average |
| :--- | :---: | :---: | :---: | :---: | :---: | :---: | :---: |
| **Llama-3.1-70B** | 60.42 | 58.21 | 57.31 | 46.43 | 56.74 | 57.35 | 56.90 |
| **gpt-4o-2024-05-13** | 52.00 | 56.58 | 52.77 | 46.43 | 52.13 | 47.06 | 53.12 |
| **Qwen2.5-72B** | 49.29 | 50.85 | 50.39 | 53.57 | 49.89 | 35.29 | 49.82 |
| **Qwen2.5-32B** | 53.75 | 50.56 | 50.83 | 39.29 | 47.26 | 41.18 | 49.37 |
| **Mixtral-8x22B-v0.1** | 46.38 | 47.61 | 46.12 | 44.44 | 46.45 | 47.06 | 46.48 |
| **Mixtral-8x7B-v0.1** | 44.72 | 46.30 | 45.10 | 45.63 | 46.01 | 47.06 | 45.99 |
| **Qwen2.5-7B** | 36.69 | 39.61 | 40.21 | 58.57 | 43.19 | 32.73 | 41.57 |
| **Llama-3.1-8B** | 43.19 | 41.26 | 40.83 | 51.67 | 41.81 | 26.27 | 41.24 |
| **claude-3-haiku-20240307** | 42.14 | 40.80 | 42.51 | 39.29 | 43.21 | 29.41 | 40.77 |
| **gpt-4o-mini-2024-07-18** | 41.43 | 38.80 | 38.99 | 50.00 | 37.78 | 47.06 | 39.29 |
| **claude-3-sonnet-20240229** | 37.14 | 35.80 | 34.80 | 39.29 | 31.90 | 29.41 | 34.56 |
| **Qwen2.5-3B** | 39.06 | 32.10 | 32.54 | 48.15 | 33.25 | 26.79 | 33.26 |
| **Llama-3.2-3B** | 34.53 | 34.84 | 35.95 | 21.32 | 27.98 | 22.22 | 32.10 |
| **Mistral-7B-v0.1** | 4.70 | 0.40 | 5.85 | 3.57 | 0.45 | 0.00 | 2.81 |
| **Qwen2.5-0.5B** | 0.00 | 0.00 | 0.00 | 0.00 | 0.00 | 0.00 | 0.00 |
| **Llama-3.2-1B** | -3.39 | -2.77 | -0.69 | 1.52 | -6.17 | 23.78 | -2.46 |
| **Average** | **36.38** | **35.68** | **35.84** | **36.82** | **34.49** | **32.04** | |
### Key Observations
1. **Top Performers:** Llama-3.1-70B is the highest-performing model overall, leading in 5 of 6 individual categories and the micro-average. gpt-4o-2024-05-13 is the second-highest performer.
2. **Category Difficulty:** The "Others" category has the lowest average score (32.04), suggesting it may be the most challenging or diverse set of errors. "Scientific Misconception" has the highest average (36.82).
3. **Model Size Correlation:** There is a general, but not perfect, correlation between model size (parameter count) and performance. The largest models (70B, 72B, 32B) occupy the top rows, while the smallest models (0.5B, 1B, 3B) are at the bottom.
4. **Significant Outliers:**
* **Qwen2.5-7B** achieves the single highest score in the table: **58.57** in "Scientific Misconception," outperforming even the much larger Llama-3.1-70B (46.43) in that specific category.
* **Llama-3.2-1B** has negative scores in five categories, with the lowest being **-6.17** in "Absurd Imagination." However, it scores a relatively high **23.78** in "Others," which is an anomaly compared to its other scores.
* **Qwen2.5-0.5B** scores **0.00** across all categories, indicating a complete failure to perform on this benchmark or a baseline measurement.
* **Mistral-7B-v0.1** scores very low (single digits) across all categories, significantly underperforming other models of similar or smaller size (e.g., Qwen2.5-7B).
5. **Performance Spread:** The spread of scores within a model can be large. For example, Qwen2.5-7B ranges from 32.73 ("Others") to 58.57 ("Scientific Misconception").
### Interpretation
This table provides a comparative benchmark of LLM robustness against specific types of reasoning failures. The data suggests that:
* **Capability is Not Uniform:** A model's ability to avoid errors is highly category-dependent. Strengths in logical reasoning (e.g., Qwen2.5-32B) do not guarantee strength in avoiding scientific misconceptions. This implies that evaluation must be multi-faceted.
* **The "Others" Category is a Key Differentiator:** The low average and high variance in the "Others" column suggest this catch-all category contains unique challenges that separate model capabilities significantly. Llama-3.2-1B's anomalous performance here hints it may have a specific, narrow capability that other small models lack.
* **Negative Scores Indicate Pathological Behavior:** The negative values for Llama-3.2-1B are particularly noteworthy. They may indicate that the model's outputs are not just unhelpful but actively incorrect or misleading at a rate worse than a random or baseline agent, especially regarding "Absurd Imagination."
* **Benchmark Design Implications:** The 0.00 scores for Qwen2.5-0.5B and near-zero scores for Mistral-7B-v0.1 suggest a potential floor effect in the benchmark, where models below a certain capability threshold cannot register a measurable score. The outlier performance of Qwen2.5-7B in one category also raises questions about whether the benchmark might be susceptible to specific model "shortcuts" or specialized training data.
In essence, this heatmap moves beyond a single "intelligence" score to reveal a landscape of strengths and weaknesses, highlighting that model selection should be guided by the specific type of error resilience required for a given application.
DECODING INTELLIGENCE...