## Diagram: Feynman Diagram Transformation
### Overview
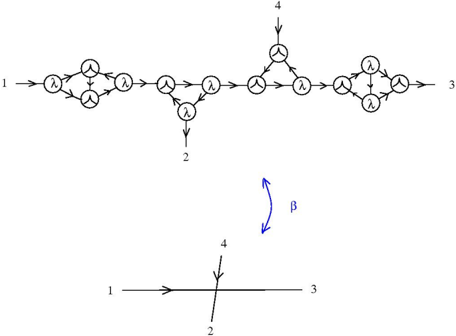
The image presents two Feynman diagrams and a transformation arrow between them. The top diagram is a more complex representation, while the bottom diagram is a simplified version. The transformation is labeled with "β".
### Components/Axes
* **Nodes:** Represented by circles, some containing the symbol "λ".
* **Lines:** Represented by arrows, indicating the direction of particle flow.
* **External Legs:** Labeled with numbers 1, 2, 3, and 4, indicating incoming or outgoing particles.
* **Transformation Arrow:** A curved blue arrow labeled "β" indicating the transformation from the complex diagram to the simplified diagram.
### Detailed Analysis
**Top Diagram:**
* **Left Side:** Starts with an incoming line labeled "1". This line connects to a node containing "λ". This node is connected to a complex structure of two nodes with "λ" inside, connected by two lines with arrows in opposite directions. This structure is connected to another node with "λ".
* **Middle Section:** The diagram continues with a series of nodes, some containing "λ". There is a branching point where a line goes downwards to an outgoing line labeled "2".
* **Right Side:** The diagram continues with a triangular structure of nodes containing "λ". This structure is connected to a diamond-shaped structure of nodes containing "λ". The diagram ends with an outgoing line labeled "3".
* **Top Branch:** A line goes upwards from the triangular structure to an outgoing line labeled "4".
**Bottom Diagram:**
* A simplified diagram with four lines intersecting at a single point.
* Incoming line labeled "1" on the left.
* Outgoing line labeled "3" on the right.
* Outgoing line labeled "2" going downwards.
* Incoming line labeled "4" coming from the top.
* **Transformation:** The blue curved arrow labeled "β" indicates the transformation from the top diagram to the bottom diagram.
### Key Observations
* The top diagram represents a more detailed interaction, while the bottom diagram represents a simplified version of the same interaction.
* The transformation "β" simplifies the complex interaction into a single vertex interaction.
* The "λ" symbol within the nodes likely represents a coupling constant or interaction strength.
### Interpretation
The image illustrates a simplification process in Feynman diagrams. The complex diagram in the top represents a higher-order interaction, which can be approximated by the simpler diagram in the bottom. The transformation "β" represents the process of reducing the complex interaction to its lowest-order approximation. This type of simplification is common in quantum field theory calculations, where higher-order diagrams are often neglected due to their smaller contributions. The parameter "λ" likely represents a coupling constant, and the diagram shows how a complex interaction involving multiple couplings can be approximated by a single effective coupling.