## Diagram: Network Flow with Feedback Loops
### Overview
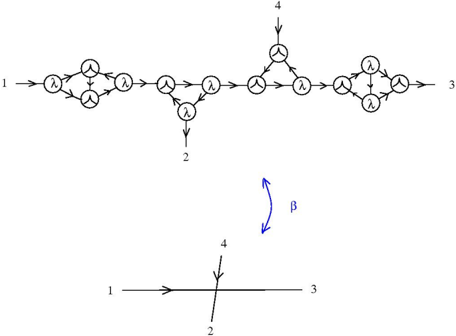
The image contains two diagrams. The top diagram is a complex network with labeled nodes (1–4), directional arrows, and symbolic annotations (λ, β). The bottom diagram is a simplified schematic with a horizontal line labeled 1–3, a vertical line labeled 2–4, and a β symbol indicating a feedback loop.
### Components/Axes
- **Top Diagram**:
- **Nodes**: Labeled 1, 2, 3, 4.
- **Arrows**:
- Black arrows with λ symbols (λ) indicating primary flow.
- Blue arrow with β symbol (β) indicating feedback.
- **Structure**:
- Node 1 connects to Node 2 via λ.
- Node 2 branches to Node 3 (λ) and Node 4 (λ).
- Node 3 connects to Node 4 via λ.
- Node 4 has a feedback loop to Node 2 via β.
- **Symbols**:
- λ: Likely represents a transformation or processing step.
- β: Represents feedback or cyclic interaction.
- **Bottom Diagram**:
- **Axes**:
- Horizontal line labeled 1 (left) and 3 (right).
- Vertical line labeled 2 (bottom) and 4 (top).
- **β Symbol**: Positioned between the horizontal and vertical lines, suggesting a feedback loop between stages 2 and 4.
### Detailed Analysis
- **Top Diagram**:
- **Flow Paths**:
- Primary flow: 1 → 2 → 3 → 4.
- Secondary flow: 2 → 4 (via λ) and 4 → 2 (via β).
- **Node 2**: Acts as a hub with multiple outgoing connections (to 3 and 4).
- **Node 4**: Receives input from Node 3 and feeds back to Node 2.
- **Bottom Diagram**:
- **β Symbol**: Positioned at the intersection of the horizontal (1–3) and vertical (2–4) lines, indicating a feedback mechanism between stages 2 and 4.
### Key Observations
1. **Feedback Loops**: The β symbol in both diagrams highlights cyclic interactions, critical for system stability or iterative processes.
2. **Node 2**: Central to both diagrams, serving as a convergence point for multiple pathways.
3. **Simplification**: The bottom diagram abstracts the top network into a minimal representation, emphasizing the feedback loop.
### Interpretation
- **System Dynamics**: The diagrams likely model a process with sequential stages (1–4) and feedback mechanisms (β). Node 2’s central role suggests it is a critical control or decision point.
- **λ vs. β**: λ may denote linear progression, while β indicates non-linear, recursive interactions.
- **Purpose**: These diagrams could represent workflows, data processing pipelines, or control systems where feedback is essential for adaptation or error correction.
**Note**: The image does not contain numerical data or explicit legends. Symbols (λ, β) and labels (1–4) are inferred from their placement and context.