\n
## Diagram: Neural Association Model Flow
### Overview
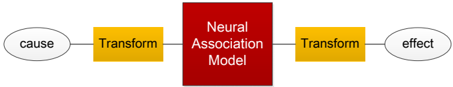
The image depicts a simplified diagram illustrating the flow of information through a "Neural Association Model". It shows a linear process starting with a "cause", undergoing two "Transform" stages, and resulting in an "effect". The diagram uses shapes to represent different stages, with arrows indicating the direction of flow.
### Components/Axes
The diagram consists of the following components:
* **Cause:** Represented by a grey circle on the left.
* **Transform (1):** Represented by a yellow rectangle connected to the "cause".
* **Neural Association Model:** Represented by a large red rectangle in the center.
* **Transform (2):** Represented by a yellow rectangle connected to the "Neural Association Model".
* **Effect:** Represented by a grey circle on the right.
* **Arrows:** Lines connecting the components, indicating the direction of information flow.
There are no axes or scales present in this diagram.
### Detailed Analysis or Content Details
The diagram shows a sequential process:
1. A "cause" initiates the process.
2. The "cause" is fed into the first "Transform" stage.
3. The output of the first "Transform" is input into the "Neural Association Model".
4. The output of the "Neural Association Model" is fed into the second "Transform" stage.
5. The output of the second "Transform" results in an "effect".
The diagram does not provide any numerical data or specific details about the transformations or the model itself. It is a high-level conceptual representation.
### Key Observations
The diagram emphasizes a linear, sequential flow of information. The "Neural Association Model" is positioned as the central processing unit, receiving input from the first transformation and providing output to the second. The use of distinct shapes and colors helps to visually differentiate the components.
### Interpretation
This diagram illustrates a simplified model of how a neural association model might process information. The "cause" represents an initial stimulus or input, and the "effect" represents the outcome or result. The "Transform" stages likely represent pre-processing or post-processing steps that prepare the input for the model and interpret the output, respectively. The "Neural Association Model" itself is the core component where the association and processing of information occur.
The diagram suggests a functional relationship between cause and effect, mediated by the neural association model and transformation processes. It is a conceptual illustration and does not provide details about the specific algorithms or mechanisms used within the model or the nature of the transformations. The diagram is useful for understanding the overall flow of information but lacks the detail needed for a technical implementation.