## Diagram: Neural Association Model Process Flow
### Overview
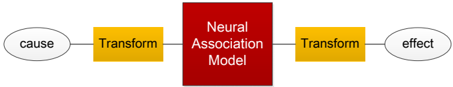
The image displays a linear, left-to-right process flow diagram illustrating a transformation pipeline centered around a "Neural Association Model." The diagram uses distinct shapes and colors to denote different types of components in the sequence.
### Components/Axes
The diagram consists of five connected components arranged horizontally:
1. **Start Point (Left):** An oval shape containing the text "cause".
2. **First Process:** A yellow rectangle labeled "Transform".
3. **Central Model:** A large, prominent red square labeled "Neural Association Model".
4. **Second Process:** Another yellow rectangle labeled "Transform".
5. **End Point (Right):** An oval shape containing the text "effect".
**Spatial Layout:** The components are connected by straight, horizontal lines, indicating a unidirectional flow from left ("cause") to right ("effect"). The "Neural Association Model" is centrally positioned and is the largest visual element, emphasizing its core role. The two "Transform" boxes are symmetrically placed on either side of the central model.
### Detailed Analysis
* **Flow Direction:** The process flows strictly from left to right: `cause` → `Transform` → `Neural Association Model` → `Transform` → `effect`.
* **Component Types & Semantics:**
* **Ovals ("cause", "effect"):** Typically represent start/end points, inputs, or outputs in flowcharts.
* **Yellow Rectangles ("Transform"):** Represent processing steps or functions. Their identical labeling and color suggest they perform analogous operations, possibly encoding and decoding, or applying similar transformations before and after the core model.
* **Red Square ("Neural Association Model"):** Represents the core processing unit or system. Its distinct color (red) and larger size highlight it as the primary, complex component where the main associative or inferential processing occurs.
* **Connections:** Simple lines connect the components, indicating a direct sequential relationship without branching or feedback loops.
### Key Observations
1. **Symmetry:** The diagram is highly symmetrical around the central "Neural Association Model," with identical "Transform" steps flanking it.
2. **Color Coding:** A deliberate color scheme is used: neutral ovals for termini, yellow for intermediate transformations, and red for the central model.
3. **Abstraction:** The diagram is highly abstract. It defines a structural framework (`cause` → `transform` → `model` → `transform` → `effect`) but provides no specifics about the nature of the "Transform" operations or the internal workings of the "Neural Association Model."
4. **Unidirectional Flow:** The flow is strictly linear and feed-forward, with no indication of cycles, iterations, or parallel processing.
### Interpretation
This diagram conceptually outlines a **causal inference or transformation pipeline**. It suggests a framework where an initial cause is first transformed into a suitable representation for processing by a neural network model. This model, likely trained on associative patterns, then produces an internal representation or prediction. This output is subsequently transformed again to yield a final, interpretable effect.
The symmetry implies that the pre- and post-processing transformations might be inverse operations (e.g., embedding and de-embedding) or serve to bridge the representational gap between the raw cause/effect data and the model's internal feature space. The central placement and emphasis on the "Neural Association Model" indicate that the core intelligence or pattern recognition resides there, while the "Transform" steps are necessary conduits.
**Peircean Investigative Reading:** The diagram functions as an **iconic sign** representing a process. Its structure (linear flow) and components (shapes, colors) directly resemble the conceptual relationship it depicts. The "cause" and "effect" ovals are **indices** pointing to the start and end of the process. The "Neural Association Model" is a **symbol**, as its meaning (a complex computational system) is defined by convention within the field of AI. The diagram as a whole argues that understanding the relationship between cause and effect requires passing through a structured, transformative process mediated by a learned associative model. The lack of detail invites the viewer to infer the specific mechanisms based on their knowledge of neural networks and causal modeling.