## Flowchart: Causal Process Mediated by Neural Association Model
### Overview
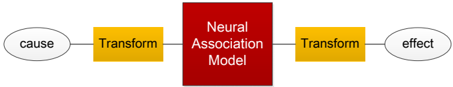
The image depicts a sequential causal process diagram with four key components: a "cause" (left), two "Transform" steps (yellow rectangles), a central "Neural Association Model" (red rectangle), and an "effect" (right). Arrows indicate directional flow between elements.
### Components/Axes
- **Left Oval**: Labeled "cause" (gray background).
- **First Yellow Rectangle**: Labeled "Transform" (black text).
- **Central Red Rectangle**: Labeled "Neural Association Model" (white text).
- **Second Yellow Rectangle**: Labeled "Transform" (black text).
- **Right Oval**: Labeled "effect" (gray background).
- **Arrows**: Connect components in sequence (left to right).
### Detailed Analysis
- **Cause → First Transform**: Arrow originates from "cause" oval, pointing to the first "Transform" rectangle.
- **First Transform → Neural Association Model**: Arrow connects the first "Transform" to the central "Neural Association Model."
- **Neural Association Model → Second Transform**: Arrow links the model to the second "Transform" rectangle.
- **Second Transform → Effect**: Final arrow directs from the second "Transform" to the "effect" oval.
### Key Observations
1. The process is linear and unidirectional, with no feedback loops.
2. The "Neural Association Model" acts as the central processing node.
3. Both "Transform" steps are identical in labeling and color, suggesting equivalence in function.
### Interpretation
This diagram illustrates a causal chain where an initial "cause" undergoes two transformation steps before being processed by a neural association model, ultimately producing an "effect." The use of identical "Transform" labels implies that both steps serve similar roles, potentially as preprocessing or feature extraction stages. The red "Neural Association Model" is visually emphasized, indicating its critical role in mediating the relationship between transformations and the final outcome. The absence of numerical data or probabilistic elements suggests this is a conceptual or architectural representation rather than a statistical model.
**Note**: No numerical values, axes, or legends are present. The diagram focuses on structural relationships and process flow.