# Technical Document Extraction: Perplexity vs. Context Chart
## 1. Image Classification and Overview
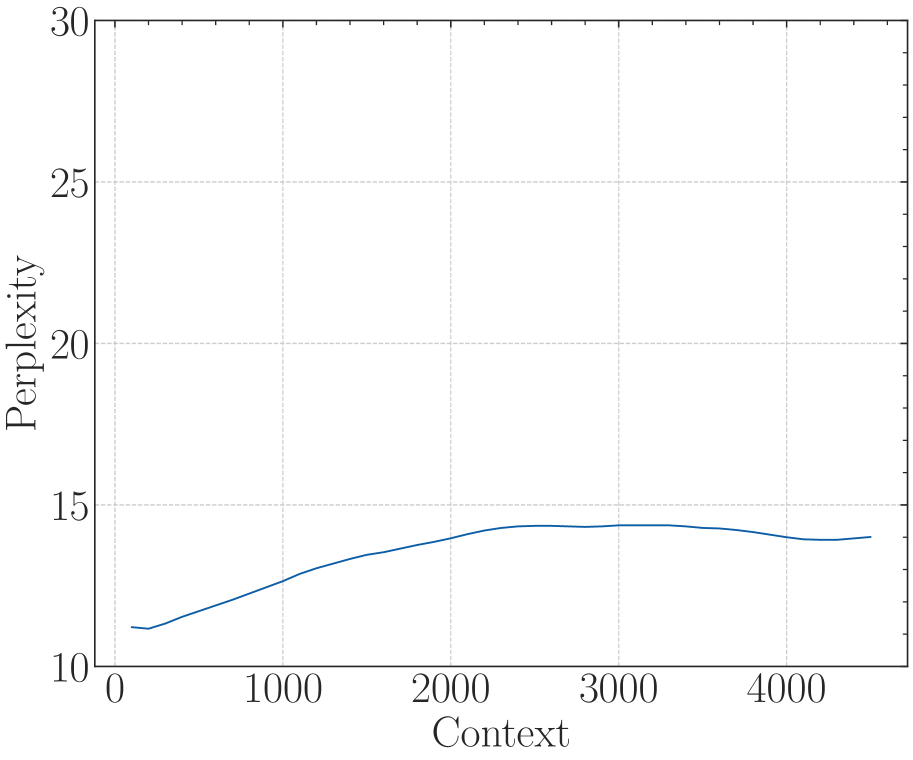
This image is a line chart depicting the relationship between "Context" (independent variable) and "Perplexity" (dependent variable). The chart is presented in a clean, academic style with a grid background.
## 2. Component Isolation
### Header/Title
* **Content:** None present.
### Main Chart Area
* **Background:** White with a light gray dashed grid.
* **Grid Lines:** Vertical and horizontal dashed lines corresponding to major axis ticks.
* **Data Series:** A single solid line in a dark blue/teal color.
### Axis Labels and Markers
* **Y-Axis (Vertical):**
* **Label:** "Perplexity" (oriented vertically).
* **Range:** 10 to 30.
* **Major Ticks:** 10, 15, 20, 25, 30.
* **Minor Ticks:** Present between major ticks (unlabeled).
* **X-Axis (Horizontal):**
* **Label:** "Context".
* **Range:** 0 to approximately 4500.
* **Major Ticks:** 0, 1000, 2000, 3000, 4000.
* **Minor Ticks:** Present at intervals of 500 (unlabeled).
### Legend
* **Location:** None present. As there is only one data series, the line color is the primary identifier.
---
## 3. Data Extraction and Trend Analysis
### Trend Verification
The data series (Dark Blue Line) exhibits a non-linear trend:
1. **Initial Phase (0 - 200):** Starts at approximately 11.2, dips slightly, then begins to rise.
2. **Growth Phase (200 - 2500):** The line slopes upward steadily, showing a positive correlation between Context and Perplexity.
3. **Plateau Phase (2500 - 3500):** The line flattens out, reaching its peak value.
4. **Slight Decline/Stabilization (3500 - 4500):** The line shows a very slight downward trend before leveling off at the end of the recorded range.
### Estimated Data Points
Based on the visual alignment with the grid and axis markers:
| Context (X) | Perplexity (Y) | Notes |
| :--- | :--- | :--- |
| ~100 | ~11.2 | Starting point |
| 500 | ~11.8 | Steady climb |
| 1000 | ~12.7 | |
| 1500 | ~13.5 | |
| 2000 | ~14.1 | Approaching plateau |
| 2500 | ~14.4 | Peak region |
| 3000 | ~14.4 | Peak region |
| 3500 | ~14.3 | Slight dip |
| 4000 | ~14.1 | |
| 4500 | ~14.1 | Final data point |
---
## 4. Summary of Information
The chart illustrates that as the **Context** increases from 0 to roughly 2500, the **Perplexity** increases from approximately 11 to 14.4. Beyond a Context value of 2500, the Perplexity stabilizes and remains relatively constant between 14.0 and 14.5 through to the Context value of 4500. This suggests a "saturation" point where additional context no longer significantly impacts the perplexity metric in the same upward trajectory.