# Technical Document Analysis: Line Graph of Perplexity vs. Context
## 1. **Axis Labels and Titles**
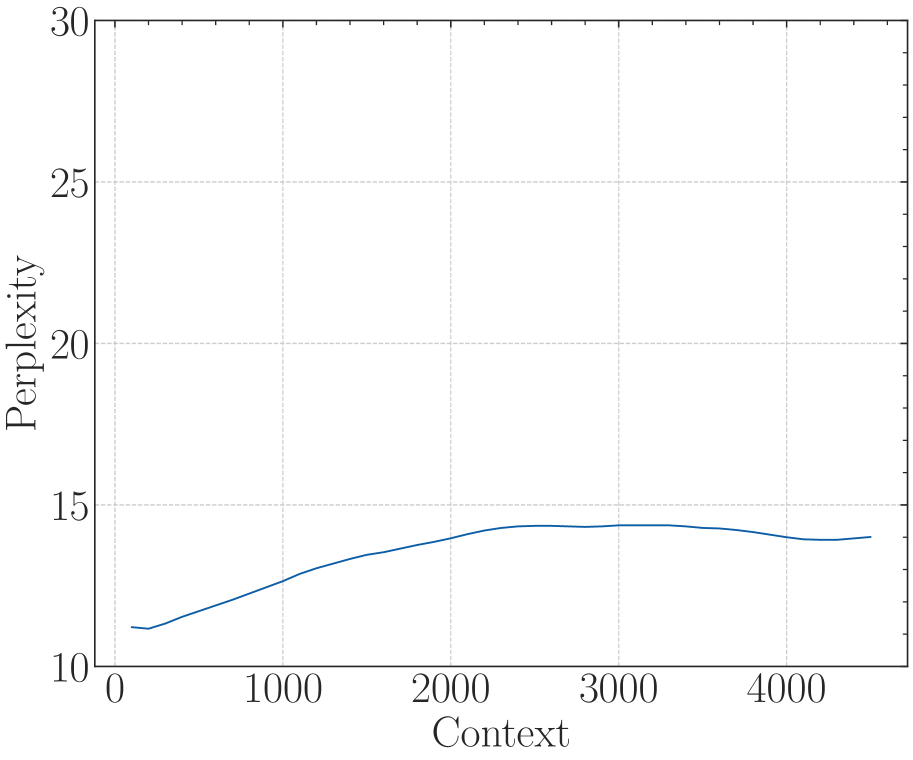
- **Y-Axis**: Labeled "Perplexity" with tick marks at intervals of 5 units (10, 15, 20, 25, 30).
- **X-Axis**: Labeled "Context" with tick marks at intervals of 1000 units (0, 1000, 2000, 3000, 4000).
- **Title**: No explicit title is present in the image.
## 2. **Legend and Data Series**
- **Legend**: No legend is present in the image.
- **Data Series**: A single blue line represents the relationship between "Context" (X-axis) and "Perplexity" (Y-axis).
## 3. **Grid and Background**
- **Grid**: Dashed gray grid lines span the entire plot area, intersecting at all axis tick marks.
## 4. **Line Graph Characteristics**
- **Line Color**: Blue.
- **Trend**:
- **Initial Slope**: The line begins at approximately (0, 11) and rises steadily to a peak at (2000, ~14.5).
- **Plateau**: From Context 2000 to 3000, the line remains relatively flat, fluctuating slightly between ~14.3 and ~14.5.
- **Decline**: After Context 3000, the line decreases gradually to ~13.5 at Context 4000.
## 5. **Data Points and Spatial Grounding**
- **Key Points**:
- (0, ~11): Starting point of the line.
- (2000, ~14.5): Peak value.
- (4000, ~13.5): Final value.
- **Legend Placement**: Not applicable (no legend exists).
## 6. **Trend Verification**
- The line exhibits a clear upward trend from Context 0 to 2000, followed by stabilization and a slight decline. This aligns with the visual slope and curvature of the plotted data.
## 7. **Component Isolation**
- **Header**: No header text or title.
- **Main Chart**:
- Axes with labeled ticks.
- Dashed grid lines.
- Blue line with plotted data points.
- **Footer**: No footer text or annotations.
## 8. **Additional Observations**
- **No Embedded Text**: No textual annotations or labels are present within the diagram itself.
- **No Data Table**: The image does not include a data table or numerical dataset.
## 9. **Language and Transcription**
- **Primary Language**: English.
- **Transcription**: All textual elements (axis labels, tick marks) are transcribed as described above.
## 10. **Final Notes**
- The graph illustrates a relationship where "Perplexity" increases with "Context" up to a threshold (Context = 2000), after which it stabilizes and slightly decreases. No additional contextual or categorical data is provided.