## Chart: Regression Model Comparison
### Overview
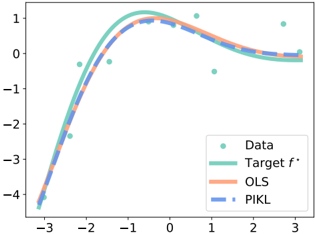
The image presents a scatter plot comparing the performance of different regression models (OLS and PIKL) against a target function. The plot shows the data points, the target function, and the predictions of the two models.
### Components/Axes
* **X-axis:** Ranges from -3 to 3, with tick marks at each integer value.
* **Y-axis:** Ranges from -4 to 1, with tick marks at each integer value.
* **Legend (bottom-right):**
* **Data:** Teal dots representing the observed data points.
* **Target f\***: Solid teal line representing the true underlying function.
* **OLS:** Solid light orange line representing the Ordinary Least Squares regression model.
* **PIKL:** Dashed light blue line representing the PIKL regression model.
### Detailed Analysis
* **Data Points:** Scattered teal dots across the plot.
* **Target f\***: The teal line starts at approximately (-3, -4), rises to a peak around (0, 1), and then decreases to approximately (3, 0).
* **OLS:** The light orange line starts at approximately (-3, -4), rises to a peak around (0, 0.7), and then decreases to approximately (3, 0).
* **PIKL:** The dashed light blue line closely follows the OLS line. It starts at approximately (-3, -4), rises to a peak around (0, 0.7), and then decreases to approximately (3, 0).
**Trend Verification:**
* **Target f\***: The line slopes upward from x=-3 to x=0, then slopes downward from x=0 to x=3.
* **OLS:** The line slopes upward from x=-3 to x=0, then slopes downward from x=0 to x=3.
* **PIKL:** The line slopes upward from x=-3 to x=0, then slopes downward from x=0 to x=3.
### Key Observations
* Both OLS and PIKL models closely approximate the target function.
* The PIKL model appears to be slightly smoother than the OLS model.
* The models deviate from the target function in areas with sparse data points.
### Interpretation
The plot demonstrates the performance of OLS and PIKL regression models in approximating a target function. Both models perform reasonably well, with PIKL showing a slightly smoother fit. The models' accuracy is influenced by the density of data points, suggesting that more data would improve their performance. The close alignment of the OLS and PIKL models suggests that, for this particular dataset and target function, the added complexity of PIKL does not provide a significant advantage over OLS.