# Technical Document Extraction: Line Graph Analysis
## 1. **Axis Labels and Markers**
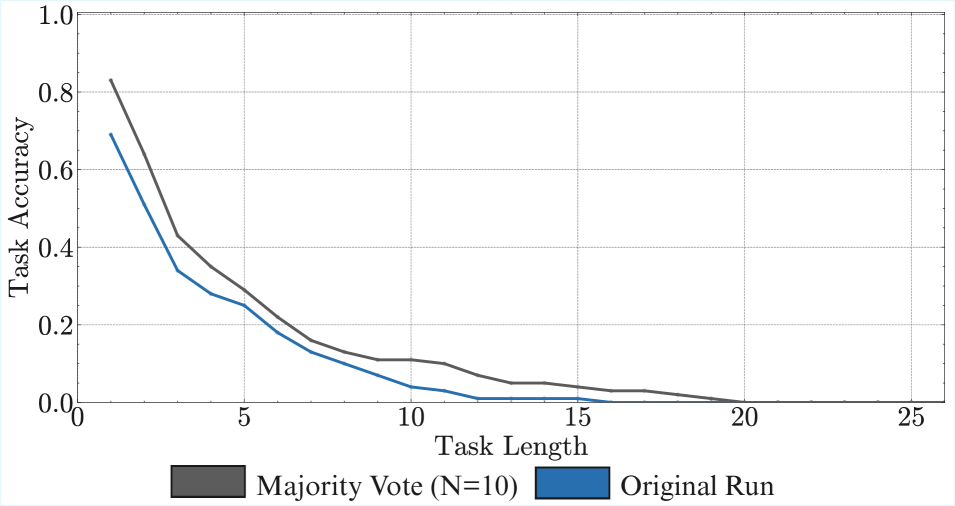
- **X-Axis (Horizontal):**
- Title: `Task Length`
- Markers: `0`, `5`, `10`, `15`, `20`, `25`
- Scale: Linear, incrementing by 5 units.
- **Y-Axis (Vertical):**
- Title: `Task Accuracy`
- Scale: Linear, ranging from `0.0` to `1.0` in increments of `0.2`.
---
## 2. **Legend and Data Series**
- **Legend Placement:** Bottom center of the graph.
- **Data Series:**
- **Majority Vote (N=10):**
- Color: Gray (`#808080`).
- Line Style: Solid.
- **Original Run:**
- Color: Blue (`#0000FF`).
- Line Style: Solid.
---
## 3. **Key Trends and Data Points**
### **Majority Vote (N=10)**
- **Trend:** Gradual decline from high to near-zero accuracy as task length increases.
- **Data Points (approximate):**
- `Task Length = 0`: `0.82`
- `Task Length = 5`: `0.30`
- `Task Length = 10`: `0.10`
- `Task Length = 15`: `0.04`
- `Task Length = 20`: `0.02`
- `Task Length = 25`: `0.00`
### **Original Run**
- **Trend:** Steeper decline compared to Majority Vote, reaching near-zero accuracy faster.
- **Data Points (approximate):**
- `Task Length = 0`: `0.70`
- `Task Length = 5`: `0.25`
- `Task Length = 10`: `0.05`
- `Task Length = 15`: `0.02`
- `Task Length = 20`: `0.01`
- `Task Length = 25`: `0.00`
---
## 4. **Visual Observations**
- Both lines exhibit **monotonic decay** (no upward trends).
- **Original Run** consistently underperforms **Majority Vote (N=10)** across all task lengths.
- **Convergence:** Both lines approach `0.0` accuracy at `Task Length = 25`.
---
## 5. **Component Isolation**
- **Main Chart:** Occupies the majority of the image.
- **Legend:** Positioned at the bottom, clearly distinguishing the two data series.
- **No Additional Elements:** No headers, footers, or embedded text beyond axis labels and legend.
---
## 6. **Language and Textual Content**
- **Language:** English (no non-English text detected).
- **Transcribed Text:**
- Axis titles: `Task Length`, `Task Accuracy`.
- Legend labels: `Majority Vote (N=10)`, `Original Run`.
---
## 7. **Spatial Grounding**
- **Legend Coordinates:** Bottom center (exact placement unspecified, but visually centered).
- **Data Point Color Verification:**
- Gray line matches `Majority Vote (N=10)`.
- Blue line matches `Original Run`.
---
## 8. **Conclusion**
The graph compares the performance of two methods (`Majority Vote` and `Original Run`) across increasing task lengths. Both methods show declining accuracy, but `Majority Vote (N=10)` maintains higher accuracy for longer task lengths. No additional textual or tabular data is present in the image.