# Technical Data Extraction: Task Accuracy vs. Task Length
## 1. Image Overview
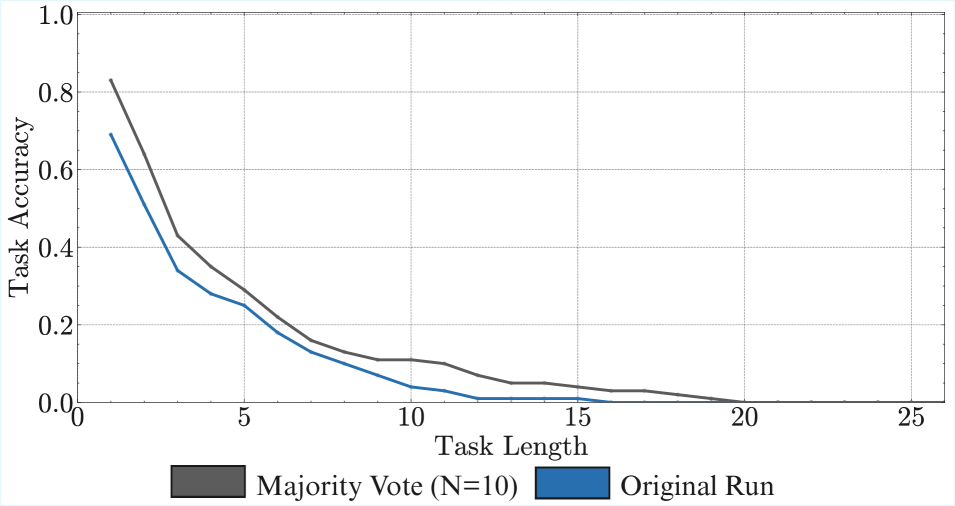
This image is a line graph illustrating the relationship between "Task Length" and "Task Accuracy." It compares two different methodologies: an "Original Run" and a "Majority Vote (N=10)" approach.
## 2. Component Isolation
### A. Header / Title
* **Text:** None explicitly provided as a header; the information is contained within the axis labels and legend.
### B. Main Chart Area (Axes and Grid)
* **Y-Axis Label:** Task Accuracy
* **Y-Axis Scale:** 0.0 to 1.0, with major tick marks and grid lines every 0.2 units.
* **X-Axis Label:** Task Length
* **X-Axis Scale:** 0 to 25, with major tick marks and grid lines every 5 units. Minor tick marks are visible every 1 unit.
* **Grid:** A dashed light-gray grid is present for both horizontal and vertical major increments.
### C. Legend (Footer Region)
* **Location:** Centered at the bottom of the image, below the X-axis.
* **Series 1:** Dark Gray Box — **Majority Vote (N=10)**
* **Series 2:** Blue Box — **Original Run**
---
## 3. Trend Verification and Data Extraction
### Series 1: Majority Vote (N=10)
* **Color:** Dark Gray
* **Visual Trend:** The line starts at its highest point (approx. 0.83) at Task Length 1. It exhibits a steep exponential decay as Task Length increases. It consistently maintains a higher accuracy than the "Original Run" across all task lengths until both converge near zero at Task Length 20.
* **Estimated Data Points:**
| Task Length | Estimated Accuracy |
| :--- | :--- |
| 1 | ~0.83 |
| 3 | ~0.43 |
| 5 | ~0.29 |
| 10 | ~0.11 |
| 15 | ~0.04 |
| 20 | ~0.00 |
### Series 2: Original Run
* **Color:** Blue
* **Visual Trend:** The line starts at approximately 0.69 at Task Length 1. Like the gray line, it follows a steep downward curve. It remains below the "Majority Vote" line throughout the entire duration. The accuracy drops to near-zero faster than the majority vote, hitting a floor around Task Length 12-13.
* **Estimated Data Points:**
| Task Length | Estimated Accuracy |
| :--- | :--- |
| 1 | ~0.69 |
| 3 | ~0.34 |
| 5 | ~0.25 |
| 10 | ~0.04 |
| 12 | ~0.01 |
| 15+ | ~0.01 to 0.00 |
---
## 4. Key Findings and Observations
* **Inverse Correlation:** There is a strong inverse relationship between Task Length and Task Accuracy. As the complexity or length of the task increases, the ability of the system to maintain accuracy diminishes significantly.
* **Performance Enhancement:** The "Majority Vote (N=10)" method provides a consistent performance buffer over the "Original Run." At Task Length 1, the majority vote improves accuracy by roughly 14 percentage points.
* **Failure Threshold:** For both methods, accuracy becomes negligible (less than 10%) once the Task Length exceeds 10. By Task Length 20, accuracy is effectively 0 for both methods.
* **Language:** All text in this document is in English.