## Scatter Plot: Throughput vs. Latency Trade-offs
### Overview
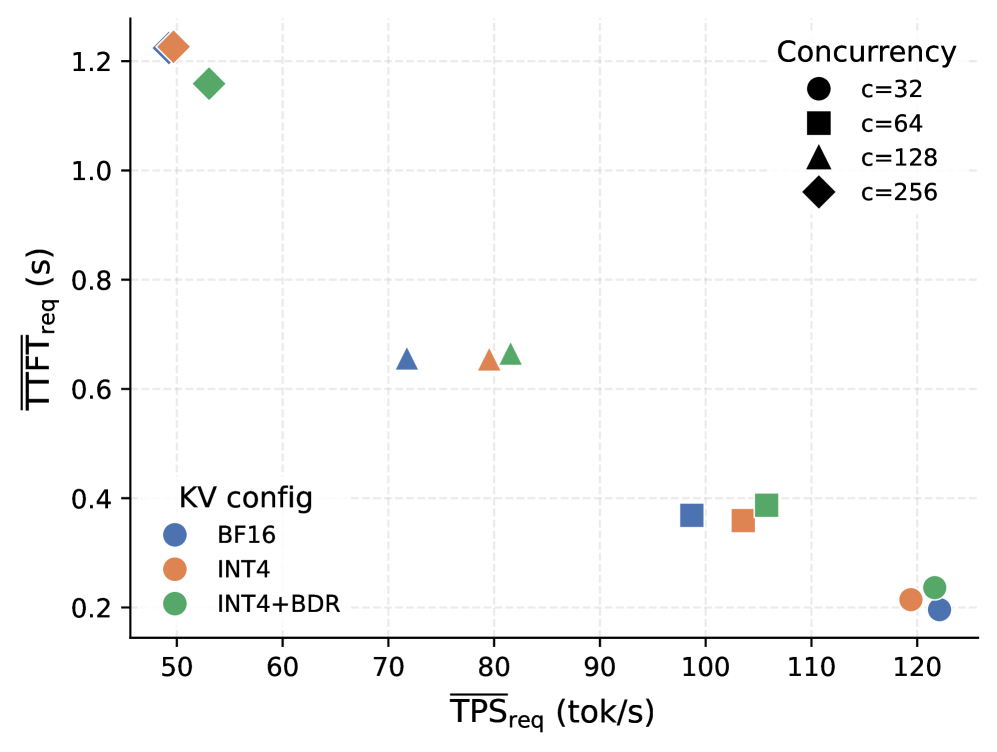
The image is a scatter plot comparing **throughput (TPS<sub>req</sub>)** and **latency (TTF<sub>req</sub>)** across different concurrency levels and key-value (KV) configurations. Data points are color-coded and shaped to represent concurrency levels (32, 64, 128, 256) and KV configurations (BF16, INT4, INT4+BDR).
---
### Components/Axes
- **X-axis (TPS<sub>req</sub>)**: Throughput in tokens per second (tok/s), ranging from 50 to 120.
- **Y-axis (TTF<sub>req</sub>)**: Latency in seconds (s), ranging from 0.2 to 1.2.
- **Legend**:
- **Blue Circle**: `c=32, BF16`
- **Orange Square**: `c=64, INT4`
- **Blue Triangle**: `c=128, BF16`
- **Green Diamond**: `c=256, INT4+BDR`
---
### Detailed Analysis
1. **High Concurrency (c=256, Green Diamonds)**:
- Located at the top-left (TPS<sub>req</sub> ≈ 50–60, TTF<sub>req</sub> ≈ 1.1–1.2s).
- Highest latency but lowest throughput.
2. **Medium Concurrency (c=128, Blue Triangles)**:
- Positioned at TPS<sub>req</sub> ≈ 70–80, TTF<sub>req</sub> ≈ 0.6–0.7s.
- Balanced throughput and latency.
3. **Low Concurrency (c=32, Blue Circles)**:
- Found at TPS<sub>req</sub> ≈ 120, TTF<sub>req</sub> ≈ 0.2–0.3s.
- Highest throughput with minimal latency.
4. **INT4 Configuration (Orange Squares)**:
- At TPS<sub>req</sub> ≈ 100–110, TTF<sub>req</sub> ≈ 0.3–0.4s.
- Moderate throughput and latency.
5. **INT4+BDR Configuration (Green Diamonds)**:
- At TPS<sub>req</sub> ≈ 110–120, TTF<sub>req</sub> ≈ 0.2–0.3s.
- Slightly higher latency than BF16 but comparable throughput.
---
### Key Observations
- **Inverse Relationship**: Higher concurrency (larger shapes) correlates with higher latency but lower throughput.
- **KV Configuration Impact**:
- `BF16` (blue circles) achieves the highest TPS and lowest TTF.
- `INT4+BDR` (green diamonds) sacrifices some throughput for reduced latency compared to `INT4`.
- **Outlier**: The green diamond at TPS<sub>req</sub> ≈ 50–60 and TTF<sub>req</sub> ≈ 1.1–1.2s represents the worst-case scenario (highest latency, lowest throughput).
---
### Interpretation
The data demonstrates a **trade-off between throughput and latency**:
- **BF16** optimizes for **high throughput** (TPS<sub>req</sub> ≈ 120) with minimal latency (TTF<sub>req</sub> ≈ 0.2–0.3s), ideal for latency-sensitive applications.
- **INT4+BDR** balances throughput and latency (TPS<sub>req</sub> ≈ 110–120, TTF<sub>req</sub> ≈ 0.2–0.3s), suitable for moderate workloads.
- **High concurrency** (e.g., `c=256`) prioritizes scalability but incurs significant latency, making it less efficient for real-time tasks.
This analysis suggests that system design should prioritize concurrency and KV configuration based on whether the application values **throughput** (e.g., batch processing) or **latency** (e.g., real-time inference).