## Chart: Brain Alignment vs. Number of Tokens for Different Pythia Models
### Overview
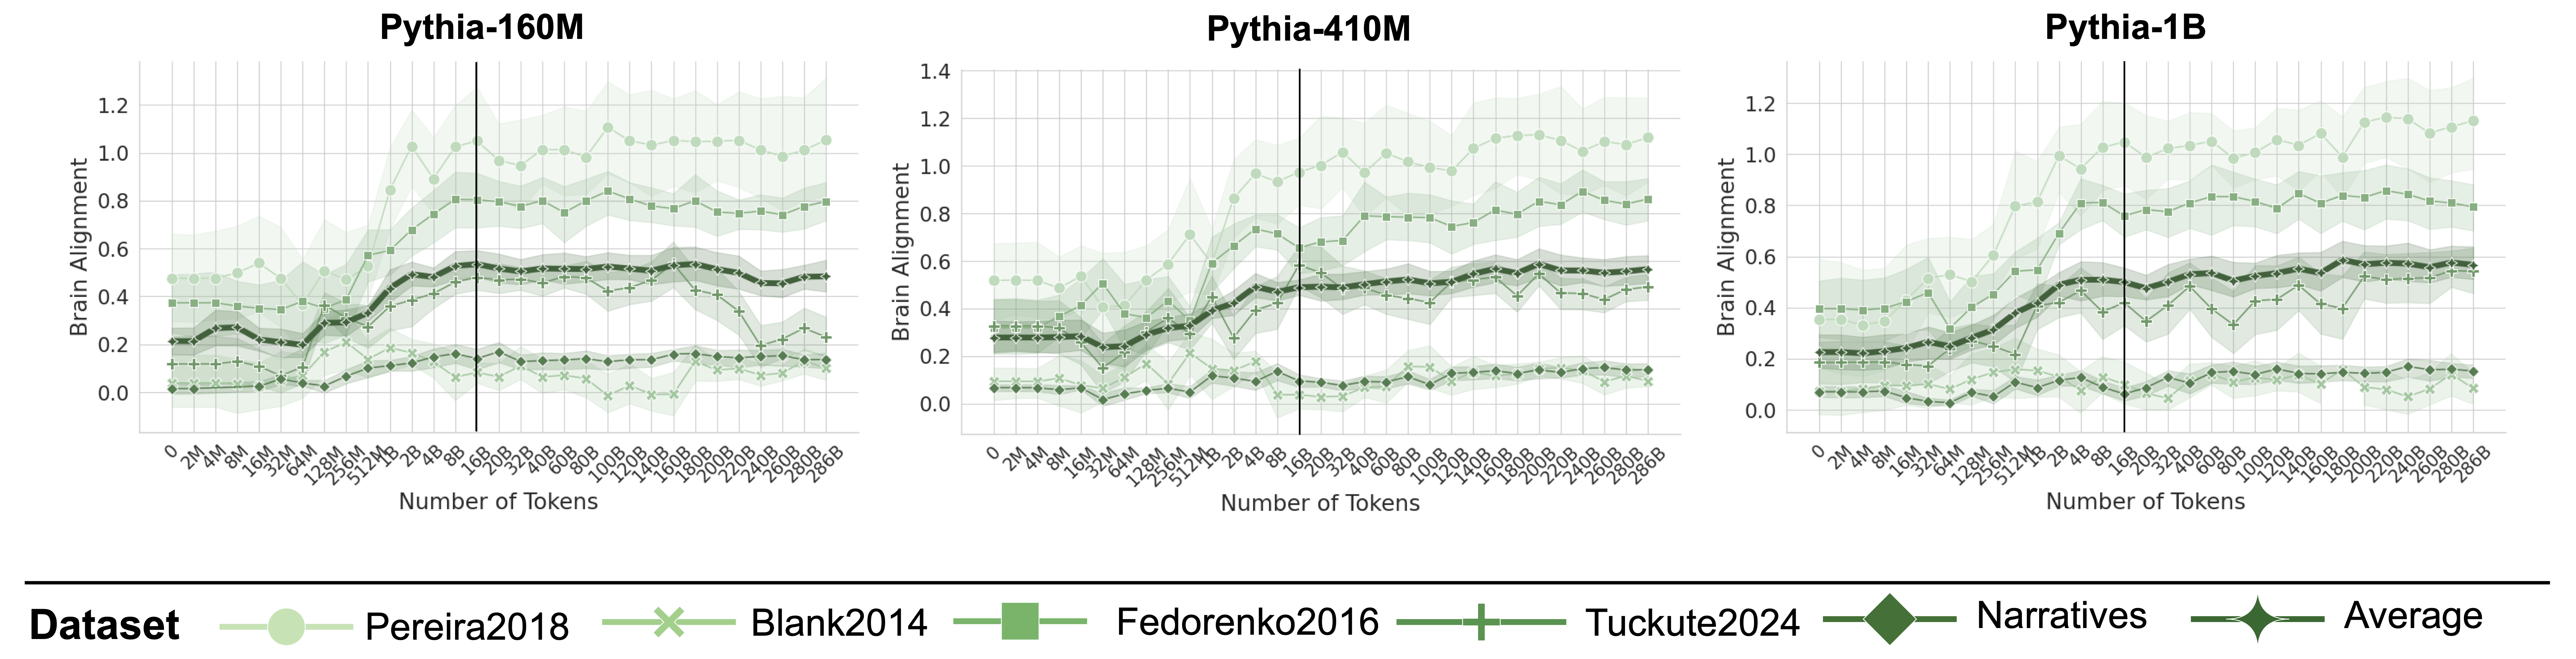
The image presents three line charts comparing brain alignment against the number of tokens processed by different Pythia language models (160M, 410M, and 1B). Each chart displays multiple data series, representing different datasets (Pereira2018, Blank2014, Fedorenko2016, Tuckute2024, Narratives) and their average. The x-axis represents the number of tokens, and the y-axis represents brain alignment.
### Components/Axes
* **Titles:**
* Left Chart: Pythia-160M
* Middle Chart: Pythia-410M
* Right Chart: Pythia-1B
* **X-Axis:** Number of Tokens
* Scale: 0, 2M, 4M, 8M, 16M, 32M, 64M, 128M, 256M, 512M, 1B, 2B, 4B, 8B, 16B, 20B, 32B, 40B, 60B, 80B, 100B, 120B, 140B, 160B, 180B, 200B, 220B, 240B, 260B, 280B, 286B
* **Y-Axis:** Brain Alignment
* Scale: 0.0, 0.2, 0.4, 0.6, 0.8, 1.0, 1.2 (Left Chart), 1.4 (Middle Chart), 1.2 (Right Chart)
* **Legend (Bottom):**
* Pereira2018 (light green circles)
* Blank2014 (light green x's)
* Fedorenko2016 (light green squares)
* Tuckute2024 (light green plus signs)
* Narratives (dark green diamonds)
* Average (dark green diamond-ended line)
* **Vertical Line:** A vertical black line is present in each chart, positioned between 8B and 16B tokens.
### Detailed Analysis
**Pythia-160M (Left Chart):**
* **Pereira2018 (light green circles):** Starts around 0.0, increases to approximately 0.5 around 16M tokens, then fluctuates between 0.4 and 0.6.
* **Blank2014 (light green x's):** Remains relatively flat around 0.1-0.2 throughout the range.
* **Fedorenko2016 (light green squares):** Starts around 0.3, increases to approximately 0.4 around 16M tokens, then fluctuates between 0.3 and 0.4.
* **Tuckute2024 (light green plus signs):** Remains relatively flat around 0.1-0.2 throughout the range.
* **Narratives (dark green diamonds):** Remains relatively flat around 0.0-0.1 throughout the range.
* **Average (dark green diamond-ended line):** Starts around 0.2, increases to approximately 0.4 around 16M tokens, then fluctuates between 0.3 and 0.4.
**Pythia-410M (Middle Chart):**
* **Pereira2018 (light green circles):** Starts around 0.1, increases to approximately 1.0 around 16M tokens, then fluctuates between 0.8 and 1.0.
* **Blank2014 (light green x's):** Remains relatively flat around 0.1-0.2 throughout the range.
* **Fedorenko2016 (light green squares):** Starts around 0.3, increases to approximately 0.7 around 16M tokens, then fluctuates between 0.6 and 0.8.
* **Tuckute2024 (light green plus signs):** Remains relatively flat around 0.2-0.3 throughout the range.
* **Narratives (dark green diamonds):** Remains relatively flat around 0.0-0.1 throughout the range.
* **Average (dark green diamond-ended line):** Starts around 0.3, increases to approximately 0.5 around 16M tokens, then fluctuates between 0.4 and 0.6.
**Pythia-1B (Right Chart):**
* **Pereira2018 (light green circles):** Starts around 0.2, increases to approximately 1.0 around 16M tokens, then fluctuates between 0.8 and 1.1.
* **Blank2014 (light green x's):** Remains relatively flat around 0.1-0.2 throughout the range.
* **Fedorenko2016 (light green squares):** Starts around 0.3, increases to approximately 0.8 around 16M tokens, then fluctuates between 0.7 and 0.8.
* **Tuckute2024 (light green plus signs):** Remains relatively flat around 0.2-0.3 throughout the range.
* **Narratives (dark green diamonds):** Remains relatively flat around 0.0-0.1 throughout the range.
* **Average (dark green diamond-ended line):** Starts around 0.2, increases to approximately 0.5 around 16M tokens, then fluctuates between 0.4 and 0.6.
### Key Observations
* **Pereira2018** dataset consistently shows the highest brain alignment across all three Pythia models, with a significant increase around 16M tokens.
* **Blank2014** and **Narratives** datasets consistently show the lowest brain alignment across all three Pythia models.
* The **Average** brain alignment generally increases up to 16M tokens and then stabilizes.
* The vertical line at approximately 16B tokens does not appear to correlate with any significant change in the trends of the data series.
* The brain alignment values for Pereira2018 and Fedorenko2016 datasets are significantly higher for the 410M and 1B models compared to the 160M model.
### Interpretation
The charts suggest that brain alignment, as measured by these datasets, tends to increase with the number of tokens processed by the Pythia models, up to a certain point (around 16M tokens), after which it plateaus. The Pereira2018 dataset exhibits the strongest correlation with brain activity, while Blank2014 and Narratives show the weakest. The increase in brain alignment for Pereira2018 and Fedorenko2016 with larger models (410M and 1B) indicates that these models may be better at capturing the nuances of human language processing as represented in these datasets. The vertical line at 16B tokens may represent a significant point in the training or evaluation process, but its impact on brain alignment is not immediately apparent from the data.