\n
## Line Chart: Brain Alignment vs. Number of Tokens for Pythia Models
### Overview
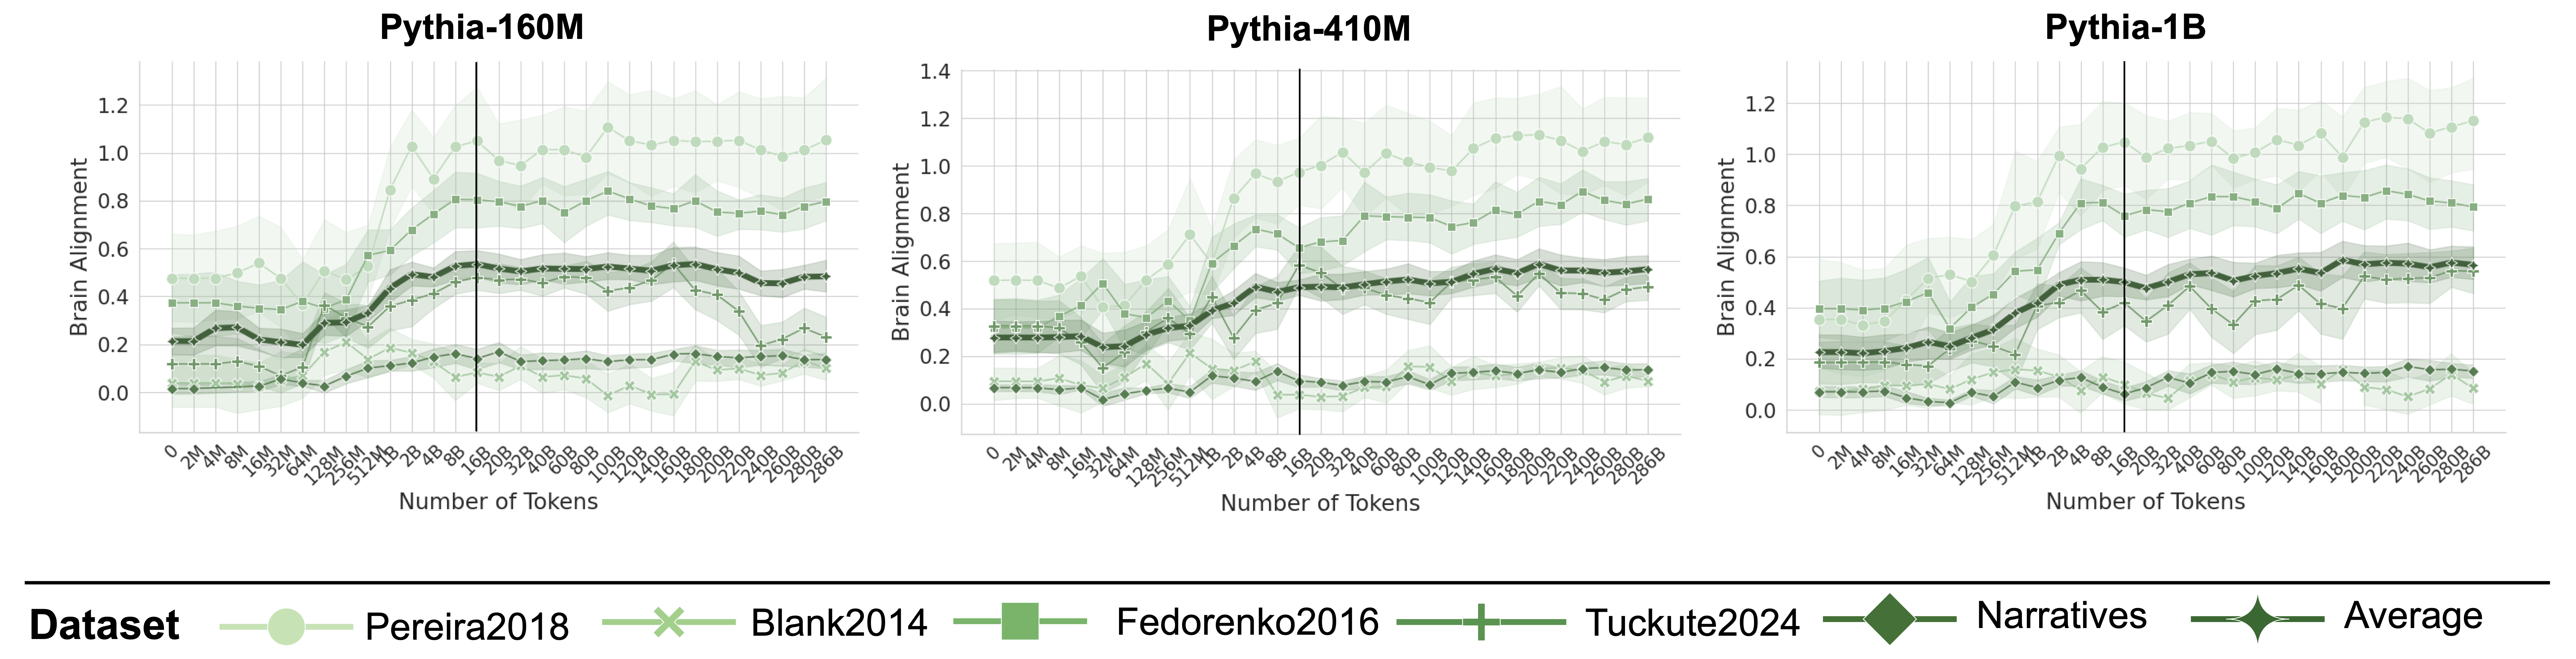
This image presents three line charts, each displaying the relationship between "Brain Alignment" (y-axis) and "Number of Tokens" (x-axis) for different datasets. The charts compare the performance of three Pythia language models: Pythia-160M, Pythia-410M, and Pythia-1B. Each chart includes data for five datasets: Pereira2018, Blank2014, Fedorenko2016, Tuckute2024, and Narratives, as well as an "Average" line.
### Components/Axes
* **X-axis:** "Number of Tokens" - Ranges from approximately 0 to 1000.
* **Y-axis:** "Brain Alignment" - Ranges from 0.0 to 1.2.
* **Charts:** Three separate charts, each representing a different Pythia model:
* Pythia-160M
* Pythia-410M
* Pythia-1B
* **Legend:** Located at the bottom-center of the image. It identifies the datasets and the average alignment using both color and marker style.
* Pereira2018 (Light Green Circle)
* Blank2014 (Light Grey X)
* Fedorenko2016 (Dark Green Square)
* Tuckute2024 (Black Diamond)
* Narratives (Dark Green Hexagon)
* Average (Black Circle)
### Detailed Analysis
**Pythia-160M:**
* **Pereira2018 (Light Green Circle):** The line starts at approximately 0.2, rises to a peak of around 1.1 at approximately 400 tokens, and then declines to around 0.6 at 1000 tokens.
* **Blank2014 (Light Grey X):** The line remains relatively low, fluctuating between 0.1 and 0.3 throughout the entire range of tokens.
* **Fedorenko2016 (Dark Green Square):** The line starts at approximately 0.3, increases to around 0.7 at 400 tokens, and then plateaus around 0.6-0.7.
* **Tuckute2024 (Black Diamond):** The line starts at approximately 0.1, rises to a peak of around 0.6 at 400 tokens, and then declines to around 0.3 at 1000 tokens.
* **Narratives (Dark Green Hexagon):** The line starts at approximately 0.2, increases to around 0.7 at 400 tokens, and then declines to around 0.4 at 1000 tokens.
* **Average (Black Circle):** The line starts at approximately 0.2, rises to a peak of around 0.7 at 400 tokens, and then declines to around 0.4 at 1000 tokens.
**Pythia-410M:**
* **Pereira2018 (Light Green Circle):** The line starts at approximately 0.3, rises to a peak of around 1.2 at approximately 400 tokens, and then declines to around 0.7 at 1000 tokens.
* **Blank2014 (Light Grey X):** The line remains relatively low, fluctuating between 0.1 and 0.3 throughout the entire range of tokens.
* **Fedorenko2016 (Dark Green Square):** The line starts at approximately 0.4, increases to around 0.8 at 400 tokens, and then plateaus around 0.7-0.8.
* **Tuckute2024 (Black Diamond):** The line starts at approximately 0.2, rises to a peak of around 0.7 at 400 tokens, and then declines to around 0.4 at 1000 tokens.
* **Narratives (Dark Green Hexagon):** The line starts at approximately 0.3, increases to around 0.8 at 400 tokens, and then declines to around 0.5 at 1000 tokens.
* **Average (Black Circle):** The line starts at approximately 0.3, rises to a peak of around 0.8 at 400 tokens, and then declines to around 0.5 at 1000 tokens.
**Pythia-1B:**
* **Pereira2018 (Light Green Circle):** The line starts at approximately 0.3, rises to a peak of around 1.1 at approximately 400 tokens, and then declines to around 0.7 at 1000 tokens.
* **Blank2014 (Light Grey X):** The line remains relatively low, fluctuating between 0.1 and 0.3 throughout the entire range of tokens.
* **Fedorenko2016 (Dark Green Square):** The line starts at approximately 0.4, increases to around 0.8 at 400 tokens, and then plateaus around 0.7-0.8.
* **Tuckute2024 (Black Diamond):** The line starts at approximately 0.2, rises to a peak of around 0.7 at 400 tokens, and then declines to around 0.4 at 1000 tokens.
* **Narratives (Dark Green Hexagon):** The line starts at approximately 0.3, increases to around 0.8 at 400 tokens, and then declines to around 0.5 at 1000 tokens.
* **Average (Black Circle):** The line starts at approximately 0.3, rises to a peak of around 0.8 at 400 tokens, and then declines to around 0.5 at 1000 tokens.
### Key Observations
* All datasets exhibit a general trend of increasing brain alignment up to approximately 400 tokens, followed by a decline.
* The "Pereira2018" dataset consistently shows the highest brain alignment across all three models.
* The "Blank2014" dataset consistently shows the lowest brain alignment across all three models.
* The "Average" line generally follows the trend of the "Narratives" dataset.
* As the model size increases (160M -> 410M -> 1B), the peak brain alignment tends to increase slightly.
### Interpretation
The charts demonstrate how well the Pythia language models align with brain activity patterns as the number of processed tokens increases. The initial increase in brain alignment suggests that the models are initially capturing relevant information from the input text. The subsequent decline may indicate that the models are losing focus or encountering diminishing returns as they process more tokens.
The consistent high performance of the "Pereira2018" dataset suggests that this dataset is particularly well-suited for evaluating brain alignment. Conversely, the low performance of the "Blank2014" dataset may indicate that it is less representative of natural language processing tasks.
The slight increase in peak brain alignment with larger model sizes suggests that larger models are capable of capturing more complex relationships between language and brain activity, but this effect is not dramatic. The overall trends are consistent across all three models, indicating a general pattern in how these models process language. The fact that all lines decline after a peak suggests a potential limitation in the models' ability to maintain alignment over extended sequences.