## Line Graphs: Brain Alignment Across Token Counts for Pythia Models
### Overview
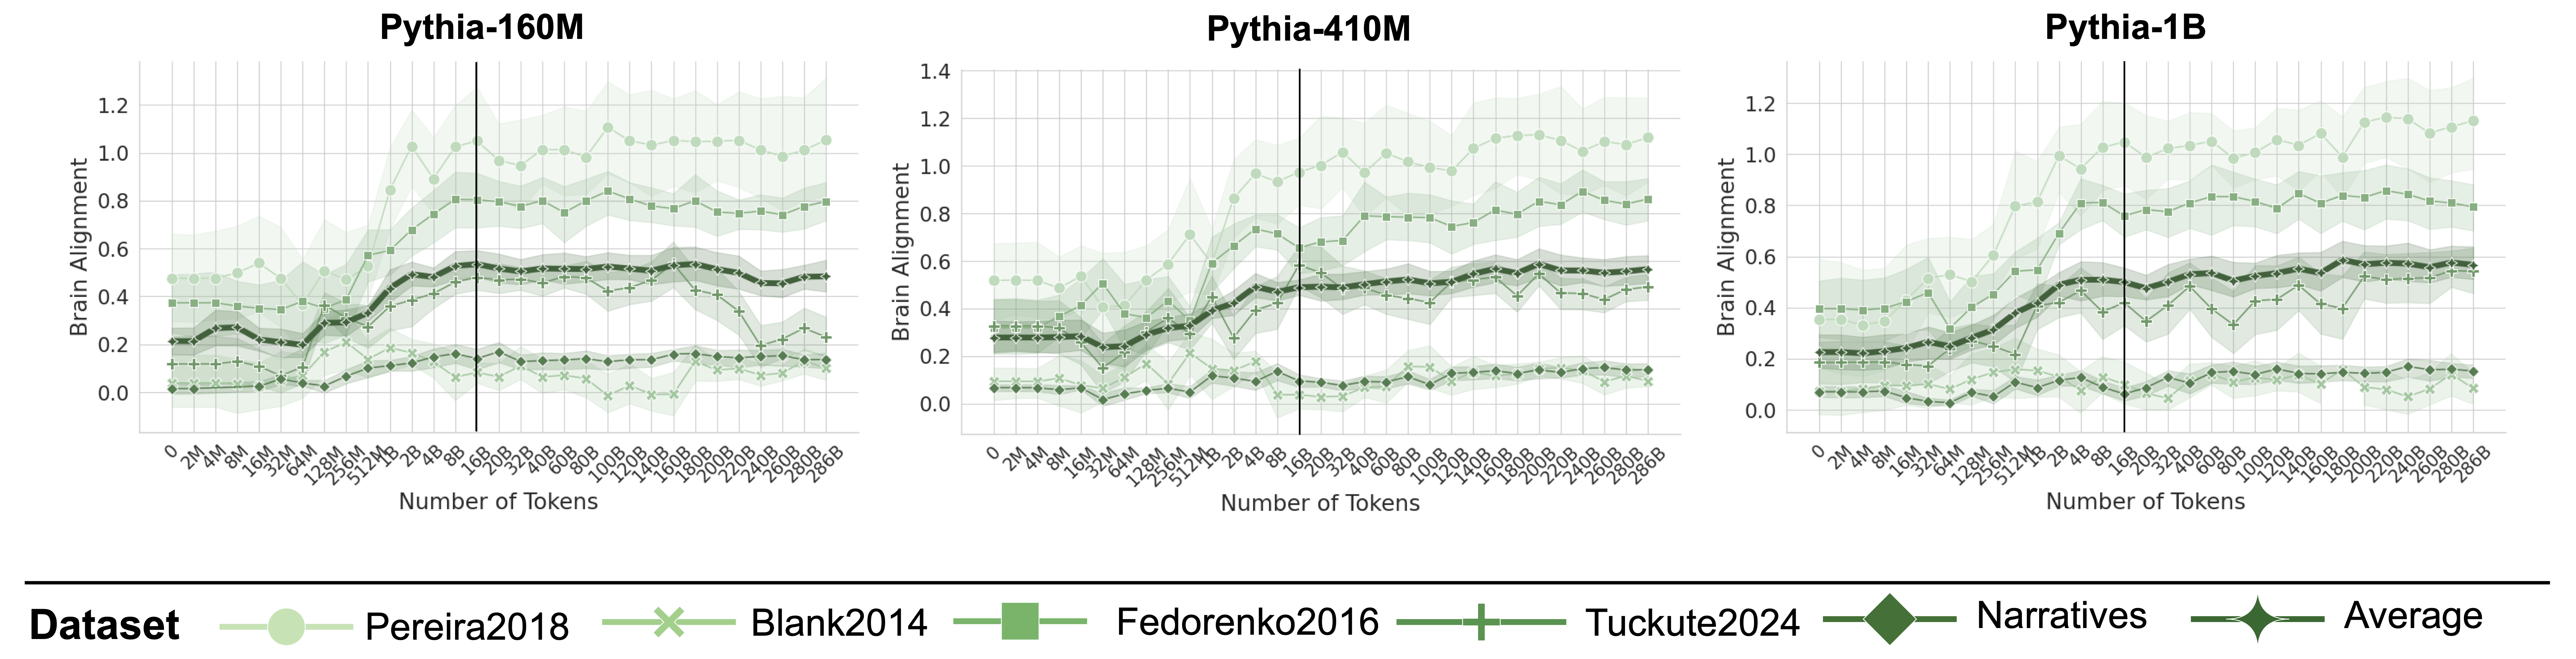
Three line graphs compare brain alignment metrics across token counts for three Pythia models (160M, 410M, 1B). Each graph shows six datasets (Pereira2018, Blank2014, Fedorenko2016, Tuckute2024, Narratives, Average) with shaded confidence intervals. A vertical dashed line marks 100B tokens, a critical threshold.
### Components/Axes
- **X-axis**: "Number of Tokens" (0 to 268B, logarithmic scale)
- **Y-axis**: "Brain Alignment" (0 to 1.2, linear scale)
- **Legend**: Located at the bottom, with symbols/colors:
- Light green circles: Pereira2018
- Light green crosses: Blank2014
- Dark green squares: Fedorenko2016
- Dark green pluses: Tuckute2024
- Dark green diamonds: Narratives
- Dark green stars: Average
- **Vertical dashed line**: 100B tokens (center of each graph)
### Detailed Analysis
#### Pythia-160M
- **Pereira2018** (light green circles): Starts at ~0.5 (0 tokens), peaks at ~1.0 (100B tokens), declines to ~0.8 (268B tokens).
- **Blank2014** (light green crosses): Ranges 0.2–0.4, peaks at ~0.4 (100B tokens).
- **Fedorenko2016** (dark green squares): Starts at ~0.3, peaks at ~0.6 (100B tokens), drops to ~0.4 (268B tokens).
- **Tuckute2024** (dark green pluses): Similar to Fedorenko2016 but lower (~0.3–0.5).
- **Narratives** (dark green diamonds): Starts at ~0.2, peaks at ~0.5 (100B tokens), declines to ~0.3 (268B tokens).
- **Average** (dark green stars): Peaks at ~0.7 (100B tokens), declines to ~0.6 (268B tokens).
#### Pythia-410M
- **Pereira2018**: Starts at ~0.6, peaks at ~1.1 (100B tokens), declines to ~0.9 (268B tokens).
- **Blank2014**: Ranges 0.3–0.5, peaks at ~0.5 (100B tokens).
- **Fedorenko2016**: Starts at ~0.4, peaks at ~0.7 (100B tokens), drops to ~0.5 (268B tokens).
- **Tuckute2024**: Similar to Fedorenko2016 but lower (~0.4–0.6).
- **Narratives**: Starts at ~0.3, peaks at ~0.6 (100B tokens), declines to ~0.4 (268B tokens).
- **Average**: Peaks at ~0.8 (100B tokens), declines to ~0.7 (268B tokens).
#### Pythia-1B
- **Pereira2018**: Starts at ~0.7, peaks at ~1.2 (100B tokens), declines to ~1.0 (268B tokens).
- **Blank2014**: Ranges 0.4–0.6, peaks at ~0.6 (100B tokens).
- **Fedorenko2016**: Starts at ~0.5, peaks at ~0.8 (100B tokens), drops to ~0.6 (268B tokens).
- **Tuckute2024**: Similar to Fedorenko2016 but lower (~0.5–0.7).
- **Narratives**: Starts at ~0.4, peaks at ~0.7 (100B tokens), declines to ~0.5 (268B tokens).
- **Average**: Peaks at ~0.9 (100B tokens), declines to ~0.8 (268B tokens).
### Key Observations
1. **Peak at 100B tokens**: All datasets show maximum brain alignment at 100B tokens, followed by a decline.
2. **Model scaling**: Larger models (Pythia-1B) exhibit higher alignment values than smaller models (Pythia-160M).
3. **Dataset variability**: Pereira2018 and Blank2014 consistently outperform others, while Narratives and Tuckute2024 show lower alignment.
4. **Average trend**: The "Average" line (dark green stars) tracks mid-range performance across datasets.
### Interpretation
The data suggests that brain alignment peaks at 100B tokens for all models, likely reflecting an optimal balance between token quantity and cognitive processing. Larger models (Pythia-1B) achieve higher alignment, indicating scalability benefits. Pereira2018 and Blank2014 datasets outperform others, possibly due to methodological differences (e.g., narrative focus vs. generic text). The decline post-100B tokens may signal diminishing returns or overfitting. The "Average" line highlights general trends, masking dataset-specific anomalies (e.g., Tuckute2024’s dip in Pythia-1B). This analysis underscores the importance of token quantity and dataset choice in aligning neural representations with brain activity.