TECHNICAL ASSET FINGERPRINT
fbf5096cea5bb1994af83f85
Click to view fullscreen
Press ESC or click to close
FOUND IN PAPERS
EXPERT: healer-alpha-free VERSION 1
RUNTIME: free/openrouter/healer-alpha
INTEL_VERIFIED
\n
## Comparative Figure: Semantic Segmentation Method Performance
### Overview
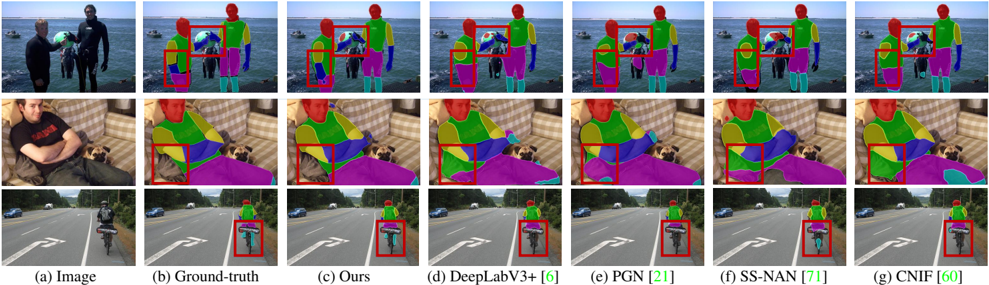
This image is a composite figure comparing the performance of six different semantic segmentation algorithms against a ground truth across three distinct photographic scenes. The figure is structured as a grid with three rows (each a different scene) and seven columns (each a different data source or algorithm output). The primary purpose is to visually evaluate and contrast the accuracy and detail of the segmentation masks produced by each method.
### Components/Axes
* **Structure:** A 3x7 grid of image panels.
* **Rows (Scenes):**
1. **Top Row:** A scene with three people standing near a body of water (likely the ocean) with boats in the background.
2. **Middle Row:** A scene of a person sitting on a couch with a dog.
3. **Bottom Row:** A scene of a cyclist riding on a paved road with lane markings.
* **Columns (Methods/Data):** Labeled at the bottom of the figure. From left to right:
* **(a) Image:** The original, unprocessed input photograph.
* **(b) Ground-truth:** The manually annotated, correct segmentation mask used as the reference standard.
* **(c) Ours:** The segmentation result from the authors' proposed method.
* **(d) DeepLabV3+ [6]:** Result from the DeepLabV3+ algorithm, citing reference [6].
* **(e) PGN [21]:** Result from the PGN (Proposal Generation Network) algorithm, citing reference [21].
* **(f) SS-NAN [71]:** Result from the SS-NAN algorithm, citing reference [71].
* **(g) CNIF [60]:** Result from the CNIF algorithm, citing reference [60].
* **Visual Elements:**
* **Segmentation Masks:** Colored overlays on the images where each color represents a different object class (e.g., person, dog, couch, road, bicycle). The color scheme is consistent across all panels for a given scene.
* **Red Bounding Boxes:** Highlight specific regions of interest or potential error in the segmentation results for closer comparison. These boxes are placed in the same location across columns (b) through (g) for each row.
### Detailed Analysis
**Column-by-Column Analysis (Across All Rows):**
* **(a) Image:** Provides the raw visual context. No segmentation data.
* **(b) Ground-truth:** Serves as the benchmark. It shows clean, precise boundaries for all objects. For example, in the top row, the person on the left is fully segmented in green, the person in the middle in blue, and the person on the right in magenta. The red box in this column highlights the area around the middle person's head and the beach ball.
* **(c) Ours:** The authors' method produces results that appear visually very close to the ground truth in all three scenes. Boundaries are sharp, and object coverage is complete. In the red-boxed regions, the segmentation of the beach ball (top row), the dog's head (middle row), and the bicycle wheel (bottom row) closely matches the ground truth.
* **(d) DeepLabV3+ [6]:** Shows generally good segmentation but with some visible imperfections. In the top row's red box, the beach ball segmentation appears slightly less complete or has a fuzzier boundary compared to (b) and (c). Similar minor discrepancies can be observed in the other scenes.
* **(e) PGN [21]:** Demonstrates noticeable errors. In the top row, the segmentation of the person on the left (green) is patchy and incomplete. In the middle row, the dog's segmentation (cyan) is fragmented and does not cover the entire animal. The red boxes highlight these areas of significant under-segmentation.
* **(f) SS-NAN [71]:** Produces results with some over-segmentation or incorrect class assignments. In the top row, the beach ball area within the red box shows incorrect color patches. In the middle row, the dog's segmentation (cyan) includes extraneous areas. The bottom row shows the bicycle (magenta) segmentation bleeding into the road.
* **(g) CNIF [60]:** Shows a mix of results. In the top row, the segmentation within the red box is reasonably accurate. However, in the middle row, the dog's segmentation (cyan) is overly large and imprecise. In the bottom row, the bicycle (magenta) segmentation is incomplete.
**Row-by-Row Observations (Focusing on Red-Boxed Areas):**
* **Top Row (Beach Scene):** The key challenge is the small, multi-colored beach ball. Ground truth (b) shows it as a distinct object. "Ours" (c) and DeepLabV3+ (d) capture it well. PGN (e) fails to segment it properly. SS-NAN (f) and CNIF (g) show partial or noisy segmentation in that region.
* **Middle Row (Couch Scene):** The challenge is the dog's complex shape and texture against the couch. Ground truth (b) shows a clean dog silhouette. "Ours" (c) matches this closely. PGN (e) severely under-segments the dog. SS-NAN (f) and CNIF (g) over-segment or mis-segment parts of the dog and surrounding couch.
* **Bottom Row (Cyclist Scene):** The challenge is the thin structures of the bicycle and the cyclist's limbs. Ground truth (b) shows precise segmentation. "Ours" (c) maintains this precision. The other methods show varying degrees of error, with PGN (e) and CNIF (g) showing the most significant omissions or inaccuracies in the bicycle wheel area highlighted by the red box.
### Key Observations
1. **Performance Hierarchy:** Visually, the method labeled "(c) Ours" consistently produces segmentation masks that are the most similar to the "(b) Ground-truth" across all three test scenes.
2. **Common Failure Modes:** Competing methods exhibit specific types of errors:
* **Under-segmentation:** PGN [21] frequently fails to cover entire objects (e.g., the dog, the person on the left).
* **Boundary Inaccuracy/Over-segmentation:** SS-NAN [71] and CNIF [60] often produce masks with fuzzy boundaries or include incorrect neighboring pixels.
* **Detail Loss:** All methods except "Ours" struggle to some degree with fine details like the beach ball or bicycle spokes, as emphasized by the red boxes.
3. **Consistency:** The relative performance ranking of the methods appears consistent across the diverse scenes (outdoor, indoor, street), suggesting the observed strengths and weaknesses are method-specific rather than scene-specific.
### Interpretation
This figure serves as a qualitative evaluation benchmark for semantic segmentation algorithms. It demonstrates that the proposed method ("Ours") achieves a higher fidelity in pixel-wise object classification compared to several established baselines (DeepLabV3+, PGN, SS-NAN, CNIF). The use of red bounding boxes directs the viewer's attention to challenging regions where differences in algorithmic performance are most pronounced, such as small objects, occlusions, and complex textures.
The data suggests that the authors' method has superior capability in preserving object boundaries and handling fine-grained details. The consistent failure of other methods in the highlighted regions indicates potential limitations in their feature extraction or context modeling modules. For a technical document, this visual evidence supports claims of state-of-the-art performance and provides a clear, intuitive understanding of where and how the new method excels. The inclusion of citation numbers ([6], [21], etc.) grounds the comparison in the existing literature, allowing readers to cross-reference the specific architectures being outperformed.
DECODING INTELLIGENCE...