## Chart Type: Stacked Histogram
### Overview
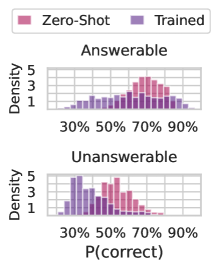
The image presents two stacked histograms, one for "Answerable" questions and one for "Unanswerable" questions. Each histogram shows the distribution of P(correct) values for two models: "Zero-Shot" (pink) and "Trained" (purple). The histograms are stacked, meaning the bars for each model are added on top of each other.
### Components/Axes
* **Y-axis (Density):** Ranges from 1 to 5, with tick marks at 1, 3, and 5.
* **X-axis (P(correct)):** Ranges from 30% to 90%, with tick marks at 30%, 50%, 70%, and 90%.
* **Titles:** "Answerable" (top histogram) and "Unanswerable" (bottom histogram).
* **Legend:** Located at the top of the image. "Zero-Shot" is represented by pink, and "Trained" is represented by purple.
### Detailed Analysis
**Answerable Histogram:**
* **Zero-Shot (Pink):** The distribution is skewed towards higher P(correct) values. The density increases from 30% to a peak around 70%-80%, then decreases slightly towards 90%.
* **Trained (Purple):** The distribution is more uniform across the range of P(correct) values, with a slight increase in density between 50% and 70%.
**Unanswerable Histogram:**
* **Zero-Shot (Pink):** The distribution is centered around 50%-60% P(correct), with a lower density at both ends of the range.
* **Trained (Purple):** The distribution is skewed towards lower P(correct) values, with a peak around 30%-40%.
### Key Observations
* For "Answerable" questions, the "Zero-Shot" model tends to have higher P(correct) values compared to the "Trained" model.
* For "Unanswerable" questions, the "Trained" model tends to have lower P(correct) values compared to the "Zero-Shot" model.
* The "Trained" model shows a clear distinction between "Answerable" and "Unanswerable" questions, with higher P(correct) for "Answerable" and lower P(correct) for "Unanswerable".
### Interpretation
The data suggests that the "Zero-Shot" model performs better on "Answerable" questions, while the "Trained" model is better at distinguishing between "Answerable" and "Unanswerable" questions. The "Trained" model seems to have learned to assign lower probabilities to "Unanswerable" questions, indicating a better understanding of the task. The "Zero-Shot" model, on the other hand, seems to assign similar probabilities to both types of questions. This could indicate that the "Zero-Shot" model is less sensitive to the nuances of the questions and answers.