## Density Plot: Model Confidence by Question Answerability
### Overview
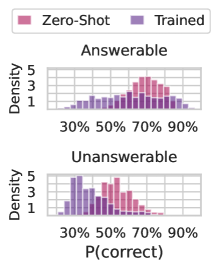
The image displays two vertically stacked density plots comparing the confidence distributions of two models ("Zero-Shot" and "Trained") on questions categorized as "Answerable" and "Unanswerable." The plots visualize the probability of a correct answer, P(correct), on the x-axis against the density of predictions on the y-axis.
### Components/Axes
* **Legend:** Positioned at the top center. Contains two entries:
* **Zero-Shot:** Represented by pink/magenta bars.
* **Trained:** Represented by purple/violet bars.
* **Top Plot Title:** "Answerable"
* **Bottom Plot Title:** "Unanswerable"
* **Shared X-Axis Label:** "P(correct)"
* **Axis Markers/Ticks:** 30%, 50%, 70%, 90%.
* **Shared Y-Axis Label:** "Density"
* **Axis Markers/Ticks:** 1, 3, 5.
### Detailed Analysis
The analysis is segmented by plot region.
**1. Top Plot: "Answerable" Questions**
* **Trend Verification:** Both distributions are skewed toward higher probabilities, indicating higher confidence for answerable questions.
* **Zero-Shot (Pink) Series:** The distribution is relatively narrow and peaks sharply in the high-confidence region. The highest density bars are located approximately between 70% and 80% P(correct). The density falls off rapidly below 60% and above 85%.
* **Trained (Purple) Series:** The distribution is broader and more spread out than the Zero-Shot series. It also peaks in the high-confidence region (around 70-80%), but with a lower maximum density. It shows a more gradual slope, with significant density extending down to the 50-60% range.
**2. Bottom Plot: "Unanswerable" Questions**
* **Trend Verification:** The distributions shift leftward toward lower probabilities compared to the "Answerable" plot, indicating lower confidence for unanswerable questions.
* **Zero-Shot (Pink) Series:** The distribution shows a clear peak in the low-to-mid confidence range. The highest density bars are located approximately between 40% and 50% P(correct). There is a long tail extending into higher probabilities, but density diminishes significantly above 70%.
* **Trained (Purple) Series:** The distribution is flatter and more uniform compared to its counterpart in the "Answerable" plot. It does not have a single sharp peak. Density is relatively consistent across the 30% to 60% range, with a slight concentration around 40-50%. It shows less density in the very high confidence regions (>70%) compared to the Zero-Shot model on unanswerable questions.
### Key Observations
1. **Confidence Calibration by Category:** Both models exhibit higher confidence (higher P(correct)) for "Answerable" questions and lower confidence for "Unanswerable" questions, which is a desirable trait.
2. **Model Behavior Difference:** The "Zero-Shot" model displays more extreme confidence distributions—sharper peaks at high confidence for answerable questions and at lower confidence for unanswerable questions. The "Trained" model's distributions are more spread out and moderate.
3. **Overconfidence on Unanswerable:** The "Zero-Shot" model retains a notable tail of high-confidence predictions (60-80% P(correct)) even for "Unanswerable" questions, suggesting potential overconfidence. The "Trained" model shows a more subdued tail in this region.
4. **Clarity of Signal:** The separation between the "Answerable" and "Unanswerable" distributions appears more distinct for the "Zero-Shot" model.
### Interpretation
This data suggests that the training process calibrates the model's confidence estimates. While the Zero-Shot model is more decisive (assigning very high or low probabilities), it may be more prone to overconfidence, particularly on difficult (unanswerable) questions. The Trained model, while less decisive, demonstrates more nuanced and potentially more reliable confidence scores across both question types. The plots visually argue that training improves a model's ability to express appropriate uncertainty, which is critical for trustworthy AI systems. The clear shift in distributions between "Answerable" and "Unanswerable" categories for both models indicates that the underlying model architecture is capable of distinguishing between these question types based on its internal representations.