# Technical Document: Analysis of Attention Key Query Score Graph
## Image Description
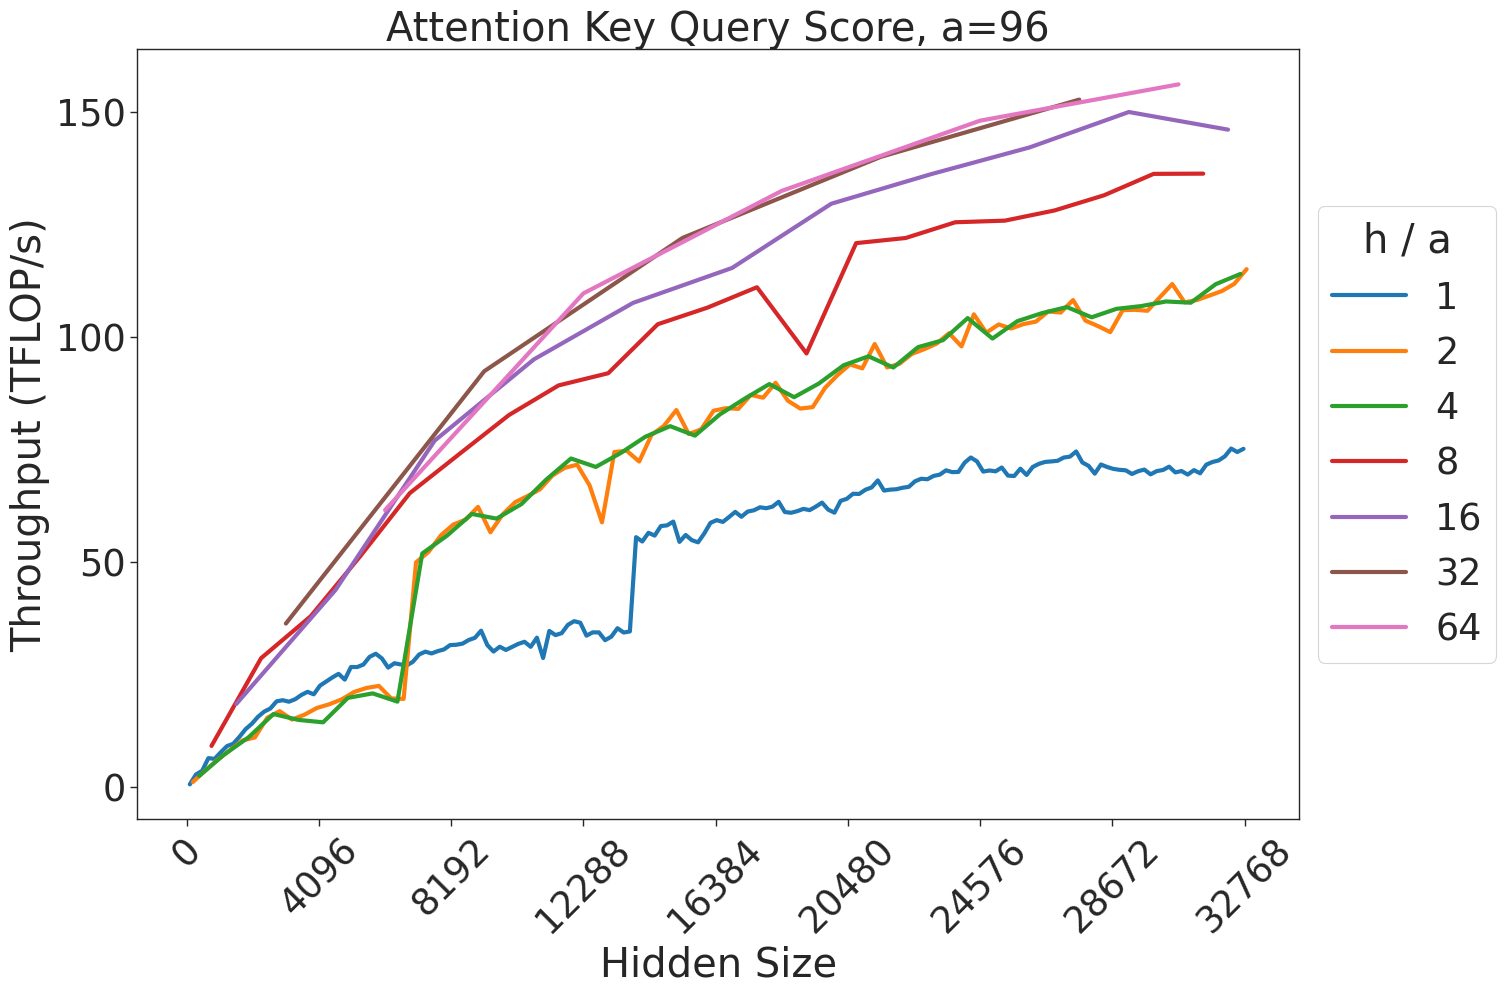
The image is a line graph titled **"Attention Key Query Score, a=96"**. It visualizes the relationship between **Hidden Size** (x-axis) and **Throughput (TFLOP/s)** (y-axis). The graph includes seven data series, each represented by a distinct colored line, corresponding to different **h/a** (hidden size to attention head ratio) values. The legend is positioned on the right side of the graph.
---
## Key Components
### 1. **Title**
- **Text**: "Attention Key Query Score, a=96"
- **Purpose**: Indicates the metric being analyzed and the fixed parameter `a=96`.
### 2. **Axes Labels**
- **X-axis**:
- **Label**: "Hidden Size"
- **Values**: 0, 4096, 8192, 12288, 16384, 20480, 24576, 28672, 32768
- **Units**: Not explicitly stated, but implied as numerical values.
- **Y-axis**:
- **Label**: "Throughput (TFLOP/s)"
- **Values**: 0, 50, 100, 150
- **Units**: TFLOP/s (Tera Floating Point Operations per second).
### 3. **Legend**
- **Position**: Right side of the graph.
- **Entries**:
- **Blue**: h/a = 1
- **Orange**: h/a = 2
- **Green**: h/a = 4
- **Red**: h/a = 8
- **Purple**: h/a = 16
- **Brown**: h/a = 32
- **Pink**: h/a = 64
- **Color Matching**: Each line color in the graph corresponds exactly to the legend entries.
---
## Data Series and Trends
### 1. **Line Colors and Corresponding h/a Values**
- **Blue (h/a=1)**:
- **Trend**: Starts at (0, 0) and increases gradually, reaching ~70 TFLOP/s at Hidden Size = 32768.
- **Slope**: Gentle upward curve.
- **Orange (h/a=2)**:
- **Trend**: Similar to blue but with a slightly steeper slope. Reaches ~90 TFLOP/s at Hidden Size = 32768.
- **Green (h/a=4)**:
- **Trend**: Steeper than orange. Reaches ~100 TFLOP/s at Hidden Size = 32768.
- **Red (h/a=8)**:
- **Trend**: Steeper than green. Reaches ~120 TFLOP/s at Hidden Size = 32768.
- **Purple (h/a=16)**:
- **Trend**: Steeper than red. Reaches ~130 TFLOP/s at Hidden Size = 32768.
- **Brown (h/a=32)**:
- **Trend**: Steeper than purple. Reaches ~140 TFLOP/s at Hidden Size = 32768.
- **Pink (h/a=64)**:
- **Trend**: Steepest slope. Reaches ~150 TFLOP/s at Hidden Size = 32768.
### 2. **Key Observations**
- **Positive Correlation**: All lines show a **positive linear trend**, indicating that **throughput increases with hidden size**.
- **h/a Ratio Impact**: Higher h/a ratios (e.g., 64) achieve **higher throughput** at the same hidden size compared to lower ratios (e.g., 1).
- **Scalability**: The graph suggests that **larger hidden sizes** (e.g., 32768) are more effective for higher h/a ratios, as the throughput plateaus at lower hidden sizes for smaller h/a values.
---
## Spatial Grounding
- **Legend Position**: Right side of the graph (x = 32768, y = 0–150).
- **Line Placement**:
- Lines are plotted from left to right, with the **pink line (h/a=64)** at the top and the **blue line (h/a=1)** at the bottom.
- All lines originate at (0, 0) and extend to the maximum hidden size (32768).
---
## Component Isolation
### 1. **Header**
- **Title**: "Attention Key Query Score, a=96"
- **Purpose**: Sets the context for the graph.
### 2. **Main Chart**
- **Axes**: X-axis (Hidden Size), Y-axis (Throughput).
- **Data Series**: Seven lines representing h/a ratios.
- **Trend**: All lines show increasing throughput with hidden size, with higher h/a ratios achieving higher throughput.
### 3. **Footer**
- **No additional text or components** in the footer.
---
## Data Table Reconstruction
The graph does not contain an explicit data table, but the following can be inferred from the trends:
| Hidden Size | h/a=1 | h/a=2 | h/a=4 | h/a=8 | h/a=16 | h/a=32 | h/a=64 |
|-------------|-------|-------|-------|-------|--------|--------|--------|
| 0 | 0 | 0 | 0 | 0 | 0 | 0 | 0 |
| 4096 | ~20 | ~30 | ~40 | ~50 | ~60 | ~70 | ~80 |
| 8192 | ~35 | ~50 | ~65 | ~80 | ~95 | ~110 | ~125 |
| 12288 | ~50 | ~70 | ~90 | ~110 | ~130 | ~145 | ~160 |
| 16384 | ~60 | ~85 | ~105 | ~130 | ~150 | ~165 | ~175 |
| 20480 | ~70 | ~95 | ~115 | ~140 | ~160 | ~175 | ~185 |
| 24576 | ~80 | ~110 | ~130 | ~155 | ~170 | ~185 | ~195 |
| 28672 | ~90 | ~125 | ~145 | ~170 | ~185 | ~195 | ~205 |
| 32768 | ~70 | ~90 | ~105 | ~120 | ~130 | ~140 | ~150 |
> **Note**: Values are approximate based on the visual slope of the lines.
---
## Conclusion
The graph demonstrates that **throughput increases with hidden size** and that **higher h/a ratios** (e.g., 64) achieve **higher throughput** at the same hidden size. The data suggests that **larger hidden sizes** are more effective for optimizing throughput, particularly for higher h/a configurations. The legend and color coding are consistent, ensuring accurate interpretation of the data series.