## Line Chart: Probability of Failure vs. Time
### Overview
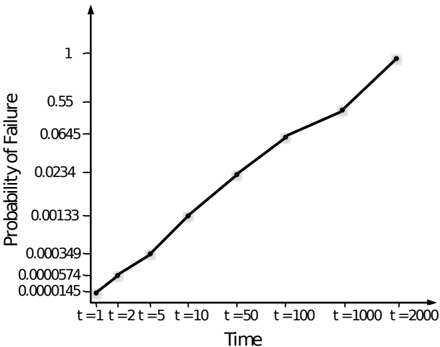
The image is a line chart illustrating the probability of failure over time. The x-axis represents time (t), and the y-axis represents the probability of failure. The chart shows an increasing trend in the probability of failure as time increases.
### Components/Axes
* **X-axis:** Time (t) with markers at t=1, t=2, t=5, t=10, t=50, t=100, t=1000, and t=2000.
* **Y-axis:** Probability of Failure with markers at 0.0000145, 0.0000574, 0.000349, 0.00133, 0.0234, 0.0645, 0.55, and 1.
* **Data Series:** A single black line with data points indicating the probability of failure at different time intervals.
### Detailed Analysis
The data series (black line) shows the following approximate values:
* At t=1, Probability of Failure ≈ 0.0000145
* At t=2, Probability of Failure ≈ 0.0000574
* At t=5, Probability of Failure ≈ 0.000349
* At t=10, Probability of Failure ≈ 0.00133
* At t=50, Probability of Failure ≈ 0.0234
* At t=100, Probability of Failure ≈ 0.0645
* At t=1000, Probability of Failure ≈ 0.55
* At t=2000, Probability of Failure ≈ 1
The line slopes upward, indicating an increasing probability of failure as time increases. The rate of increase appears to be higher in the later time intervals (t=1000 to t=2000) compared to the earlier intervals (t=1 to t=100).
### Key Observations
* The probability of failure increases with time.
* The rate of increase in the probability of failure is not constant; it appears to accelerate at later times.
* The y-axis scale is not linear, allowing for representation of both very small and relatively large probabilities of failure.
### Interpretation
The chart suggests that the likelihood of failure increases over time, and the rate of failure accelerates as time progresses. This could represent the wear and tear of a component or system, where the initial failures are rare, but as time goes on, the probability of failure increases significantly. The non-linear y-axis scale is necessary to visualize the wide range of probability values, from very small initial failure rates to near-certain failure at later times.