## Line Graph: Probability of Failure Over Time
### Overview
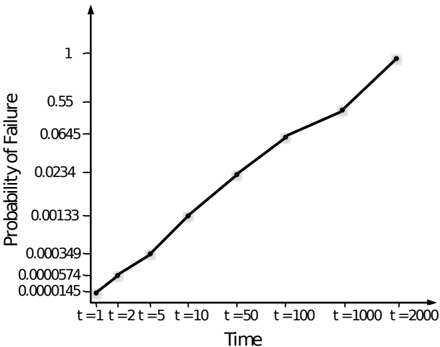
The image depicts a line graph illustrating the relationship between time (t) and the probability of failure. The x-axis represents time in discrete intervals (t=1, t=2, ..., t=2000), while the y-axis represents the probability of failure, ranging from 0 to 1. The line shows a consistent upward trend, indicating an increasing probability of failure as time progresses.
### Components/Axes
- **X-axis (Time)**: Labeled "Time" with discrete markers at t=1, t=2, t=5, t=10, t=50, t=100, t=1000, and t=2000. The scale is linear, with equal spacing between intervals.
- **Y-axis (Probability of Failure)**: Labeled "Probability of Failure" with values ranging from 0.0000145 to 1. The scale is logarithmic, as the intervals between values increase exponentially (e.g., 0.0000145, 0.0000574, 0.000349, etc.).
- **Legend**: No explicit legend is present in the image. The line is black with circular markers, but no color-coded categories or labels are provided.
- **Data Points**: Black circular markers are plotted at each time interval, connected by a solid black line.
### Detailed Analysis
- **Data Points**:
- t=1: 0.0000145
- t=2: 0.0000574
- t=5: 0.000349
- t=10: 0.00133
- t=50: 0.0234
- t=100: 0.0645
- t=1000: 0.55
- t=2000: 0.999 (approximate, as the line approaches 1)
- **Trend**: The line exhibits a **logarithmic/exponential growth pattern**, with the probability of failure increasing rapidly after t=100. The slope becomes steeper as time progresses, suggesting a nonlinear relationship between time and failure probability.
### Key Observations
1. **Exponential Growth**: The probability of failure increases dramatically after t=100, reaching ~0.55 at t=1000 and approaching 1 by t=2000.
2. **Initial Stability**: At t=1–10, the probability remains extremely low (<0.001), indicating minimal risk in the early stages.
3. **Critical Threshold**: The probability crosses 0.5 at t=1000, suggesting a 50% chance of failure by this point.
4. **Asymptotic Behavior**: The line approaches 1 asymptotically, implying the probability of failure approaches certainty as time extends beyond t=2000.
### Interpretation
The graph demonstrates that the system's failure probability grows exponentially over time, with a critical threshold of 50% failure risk occurring at t=1000. This suggests that the system becomes increasingly unreliable as it ages, with failure becoming nearly inevitable by t=2000. The absence of a legend implies a single data series, but the lack of contextual information (e.g., system type, failure criteria) limits deeper analysis. The logarithmic y-axis emphasizes the rapid escalation of risk, highlighting the importance of proactive maintenance or replacement strategies for systems operating beyond t=1000.