## Line Chart: Comparison of Training Query Sampling Methods
### Overview
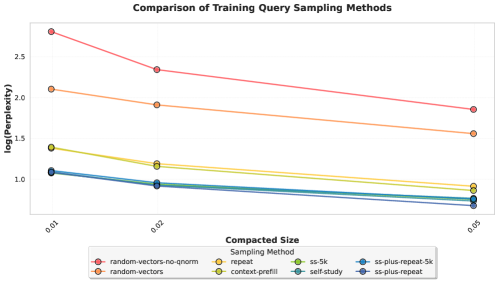
The chart compares the log(perplexity) performance of six query sampling methods across three compacted sizes (0.01, 0.02, 0.05). Log(perplexity) is plotted on the y-axis (0–2.75), with lower values indicating better performance. All methods show decreasing perplexity as compacted size increases, but performance varies significantly between methods.
### Components/Axes
- **X-axis**: Compacted Size (0.01, 0.02, 0.05)
- **Y-axis**: log(Perplexity) (0–2.75, increments of 0.5)
- **Legend**: Located at bottom-right, with six color-coded lines:
- Red: random-vectors-no-gnorm
- Orange: random-vectors
- Yellow: repeat
- Green: ss-5k
- Teal: self-study
- Blue: ss-plus-repeat-5k
### Detailed Analysis
1. **random-vectors-no-gnorm (Red)**
- Starts at ~2.75 log(perplexity) at 0.01 compacted size.
- Decreases linearly to ~1.8 at 0.05.
- Highest perplexity across all sizes.
2. **random-vectors (Orange)**
- Begins at ~2.1 log(perplexity) at 0.01.
- Declines to ~1.5 at 0.05.
- Second-highest perplexity.
3. **repeat (Yellow)**
- Starts at ~1.3 log(perplexity) at 0.01.
- Drops to ~0.9 at 0.05.
- Moderate performance.
4. **ss-5k (Green)**
- Begins at ~1.2 log(perplexity) at 0.01.
- Reduces to ~0.8 at 0.05.
- Slightly better than "repeat."
5. **self-study (Teal)**
- Starts at ~0.9 log(perplexity) at 0.01.
- Decreases to ~0.7 at 0.05.
- Near-optimal performance.
6. **ss-plus-repeat-5k (Blue)**
- Begins at ~0.8 log(perplexity) at 0.01.
- Ends at ~0.6 at 0.05.
- **Lowest perplexity**, indicating best performance.
### Key Observations
- **Performance Gradient**: All methods improve (lower perplexity) as compacted size increases, but the rate of improvement varies.
- **Dominant Outperformer**: "ss-plus-repeat-5k" (blue) consistently outperforms others by ~0.2–0.3 log(perplexity) units.
- **Worst Performer**: "random-vectors-no-gnorm" (red) has the highest perplexity, suggesting it is the least effective method.
- **Trend Consistency**: All lines slope downward, confirming that larger compacted sizes reduce perplexity.
### Interpretation
The chart demonstrates that query sampling methods significantly impact training efficiency, as measured by perplexity. The "ss-plus-repeat-5k" method achieves the lowest perplexity, suggesting it balances compacted size and model performance optimally. Conversely, "random-vectors-no-gnorm" underperforms, likely due to the absence of gnorm regularization. The downward trend across all methods implies that compacted size is a critical factor in reducing perplexity, but method choice determines the magnitude of improvement. This analysis could guide optimization strategies for training query systems, prioritizing methods like "ss-plus-repeat-5k" for efficiency.