## Diagram: Evidence and Innocence Model
### Overview
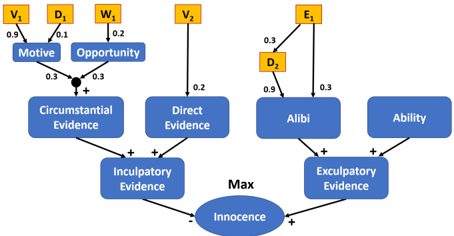
The image presents a diagram illustrating the relationship between different types of evidence and their influence on the concept of "Innocence." The diagram uses nodes (rounded rectangles and ovals) to represent concepts like "Motive," "Opportunity," "Circumstantial Evidence," "Direct Evidence," "Alibi," "Ability," "Inculpatory Evidence," "Exculpatory Evidence," and "Innocence." Arrows connect these nodes, indicating the direction of influence, with numerical values (probabilities) assigned to the arrows. The diagram also includes nodes labeled V1, D1, W1, V2, E1, and D2, which appear to be external factors influencing the evidence.
### Components/Axes
* **Nodes:**
* **Motive:** Blue rounded rectangle.
* **Opportunity:** Blue rounded rectangle.
* **Circumstantial Evidence:** Blue rounded rectangle.
* **Direct Evidence:** Blue rounded rectangle.
* **Inculpatory Evidence:** Blue rounded rectangle.
* **Alibi:** Blue rounded rectangle.
* **Ability:** Blue rounded rectangle.
* **Exculpatory Evidence:** Blue rounded rectangle.
* **Innocence:** Blue oval.
* **V1, D1, W1, V2, E1, D2:** Orange squares.
* **Arrows:** Arrows indicate the direction of influence between nodes. Each arrow is labeled with a numerical value, presumably representing a probability or weight.
* **Connectors:** "+" and "-" symbols indicate positive and negative influences, respectively.
* **Max:** Indicates a maximization operation.
### Detailed Analysis or ### Content Details
* **V1** (orange square) influences **Motive** (blue rounded rectangle) with a probability of 0.9.
* **D1** (orange square) influences **Opportunity** (blue rounded rectangle) with a probability of 0.1.
* **W1** (orange square) influences **Opportunity** (blue rounded rectangle) with a probability of 0.2.
* **Motive** and **Opportunity** both influence **Circumstantial Evidence** with probabilities of 0.3 each. The connection is marked with a "+" symbol.
* **V2** (orange square) influences **Direct Evidence** (blue rounded rectangle) with a probability of 0.2.
* **Circumstantial Evidence** and **Direct Evidence** both influence **Inculpatory Evidence** with a "+" connection.
* **E1** (orange square) influences **Alibi** (blue rounded rectangle) with a probability of 0.3.
* **D2** (orange square) influences **Alibi** (blue rounded rectangle) with a probability of 0.9.
* **Alibi** and **Ability** both influence **Exculpatory Evidence** with a probability of 0.3 each and a "+" connection.
* **Inculpatory Evidence** negatively influences **Innocence** with a "-" connection.
* **Exculpatory Evidence** positively influences **Innocence** with a "+" connection.
* The influence of **Inculpatory Evidence** and **Exculpatory Evidence** on **Innocence** is combined using a "Max" operation.
### Key Observations
* The diagram models the interplay between different types of evidence and their impact on the likelihood of innocence.
* External factors (V1, D1, W1, V2, E1, D2) influence the initial evidence nodes.
* The diagram distinguishes between inculpatory and exculpatory evidence, which have opposing effects on innocence.
* The "Max" operation suggests that the stronger of the two opposing influences (inculpatory vs. exculpatory) determines the final assessment of innocence.
### Interpretation
The diagram presents a simplified model of how evidence can be used to assess innocence. It highlights the importance of considering both inculpatory and exculpatory evidence, as well as the influence of external factors. The use of probabilities suggests that the model is intended to represent uncertainty and the relative strength of different pieces of evidence. The "Max" operation implies a decision-making process where the most compelling evidence takes precedence. This model could be used to analyze the strength of a case, identify potential weaknesses, and guide further investigation. The model suggests that innocence is not simply the absence of guilt, but rather a positive assessment based on the available evidence.