## Diagram: Legal Evidence Flowchart for Determining Innocence
### Overview
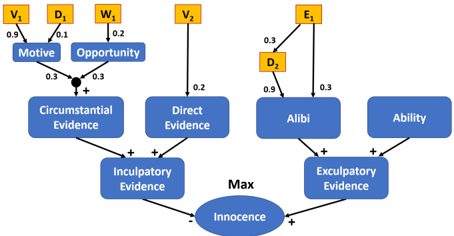
The image is a flowchart or conceptual diagram illustrating a model for how different types of legal evidence contribute to a determination of "Innocence." It uses a network of nodes (boxes and an oval) connected by directional arrows, with numerical weights assigned to most connections. The diagram appears to represent a probabilistic or weighted decision-making framework, possibly a Bayesian network or a similar logical model.
### Components/Axes
The diagram is structured hierarchically, flowing from top to bottom.
**1. Top-Level Variables (Yellow Square Nodes):**
* **V₁** (Top-left)
* **D₁** (Top-left, next to V₁)
* **W₁** (Top-left, next to D₁)
* **V₂** (Top-center)
* **E₁** (Top-right)
* **D₂** (Below E₁)
**2. Evidence Category Nodes (Blue Rectangular Nodes):**
* **Motive** (Connected from V₁, D₁, W₁)
* **Opportunity** (Connected from V₁, D₁, W₁)
* **Circumstantial Evidence** (Connected from Motive and Opportunity)
* **Direct Evidence** (Connected from V₂)
* **Alibi** (Connected from E₁ and D₂)
* **Ability** (Connected from E₁)
* **Inculpatory Evidence** (Aggregates Circumstantial and Direct Evidence)
* **Exculpatory Evidence** (Aggregates Alibi and Ability)
**3. Conclusion Node (Blue Oval):**
* **Innocence** (The final output node, connected from Inculpatory and Exculpatory Evidence)
**4. Connections and Weights (Numerical values on arrows):**
* V₁ → Motive: **0.4**
* D₁ → Motive: **0.4**
* W₁ → Motive: **0.2**
* V₁ → Opportunity: **0.3**
* D₁ → Opportunity: **0.3**
* W₁ → Opportunity: **0.4**
* Motive → Circumstantial Evidence: **0.3**
* Opportunity → Circumstantial Evidence: **0.3**
* V₂ → Direct Evidence: **0.2**
* Circumstantial Evidence → Inculpatory Evidence: **+** (Positive contribution)
* Direct Evidence → Inculpatory Evidence: **+** (Positive contribution)
* E₁ → Alibi: **0.3**
* D₂ → Alibi: **0.9**
* E₁ → Ability: **0.3**
* Alibi → Exculpatory Evidence: **+** (Positive contribution)
* Ability → Exculpatory Evidence: **+** (Positive contribution)
* Inculpatory Evidence → Innocence: **-** (Negative contribution)
* Exculpatory Evidence → Innocence: **+** (Positive contribution)
**5. Annotations:**
* The word **"Max"** is placed above the "Innocence" node, suggesting the final determination might be a maximum function or threshold based on the inputs.
### Detailed Analysis
The diagram models the formation of two opposing evidence aggregates:
1. **Inculpatory Evidence Pathway:** This is built from two sources:
* **Circumstantial Evidence:** Formed by combining **Motive** and **Opportunity**. Both are themselves derived from a set of underlying variables (V₁, D₁, W₁) with specific weights.
* **Direct Evidence:** Derived directly from variable V₂.
* Both Circumstantial and Direct Evidence contribute positively (`+`) to the total Inculpatory Evidence.
2. **Exculpatory Evidence Pathway:** This is built from two sources:
* **Alibi:** Formed from variables E₁ and D₂, with D₂ having a very strong weight (0.9).
* **Ability:** Derived from variable E₁.
* Both Alibi and Ability contribute positively (`+`) to the total Exculpatory Evidence.
3. **Final Determination:** The aggregated **Inculpatory Evidence** has a negative (`-`) impact on the **Innocence** node, while the aggregated **Exculpatory Evidence** has a positive (`+`) impact. The label "Max" suggests the system may evaluate which side (inculpatory vs. exculpatory) is stronger to reach a conclusion.
### Key Observations
* **Asymmetric Weights:** The weight from D₂ to Alibi (0.9) is the highest single weight in the diagram, indicating this factor is considered extremely influential for establishing an alibi.
* **Variable Reuse:** Variable **E₁** influences both **Alibi** and **Ability**, creating a dependency between these two exculpatory factors.
* **Balanced Inputs for Motive/Opportunity:** The inputs V₁, D₁, and W₁ contribute to both Motive and Opportunity, but with different weight distributions (e.g., W₁ contributes more to Opportunity (0.4) than to Motive (0.2)).
* **Qualitative vs. Quantitative Links:** The final links to "Innocence" are qualitative (`+`/`-`), while all preceding links are quantitative (decimal weights). This suggests a two-stage model: weighted aggregation of evidence, followed by a comparative or threshold-based final judgment.
### Interpretation
This diagram represents a formalized, analytical approach to legal reasoning, breaking down the abstract concepts of "inculpatory" and "exculpatory" evidence into measurable components. It serves as a **decision-support model** or a **conceptual framework** for understanding how different pieces of information (V₁, D₁, etc.) logically flow to support or undermine a claim of innocence.
The model implies that innocence is not determined by a single piece of evidence but by the **net balance** between two constructed arguments: the prosecution's case (Inculpatory Evidence) and the defense's case (Exculpatory Evidence). The "Max" annotation is critical—it hints that the system doesn't simply add scores but likely determines which aggregate is dominant or if a threshold is met.
The high weight on D₂→Alibi suggests the model prioritizes concrete, verifiable alibi evidence over other factors. The reuse of variables like E₁ shows how a single factual element (e.g., an expert's testimony or a documented event) can simultaneously support multiple defensive arguments (both alibi and ability).
Overall, the diagram translates legal logic into a structured, almost computational format, highlighting the interconnectedness of evidence and the importance of weighting different factors according to their perceived reliability and relevance.