## Diagram: Graph Representations and Feature Extraction
### Overview
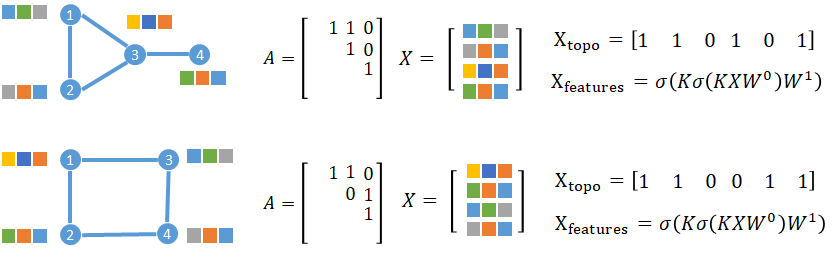
The image presents two different graph structures, each accompanied by its adjacency matrix (A), feature matrix (X), topological feature vector (X_topo), and feature extraction formula (X_features). The top graph is a triangle with an additional node connected to one of the triangle's vertices. The bottom graph is a square. Each node in the graph is associated with a set of colored blocks, representing node features.
### Components/Axes
* **Graphs:** Two undirected graphs are shown. The top graph has nodes 1, 2, 3, and 4, with edges connecting 1-2, 1-3, 2-3, and 3-4. The bottom graph has nodes 1, 2, 3, and 4, with edges connecting 1-2, 1-3, 2-4, and 3-4.
* **Node Features:** Each node (1, 2, 3, 4) in both graphs is associated with a set of colored blocks. The colors appear to be yellow, blue, orange, green, and gray. The order and presence of these colors vary for each node.
* **Adjacency Matrix (A):** A 4x4 matrix representing the connections between nodes. A '1' indicates an edge exists between the corresponding nodes, and a '0' indicates no edge.
* **Feature Matrix (X):** A matrix where each row represents the features of a node, visually represented by the colored blocks.
* **X_topo:** A vector representing topological features, encoded as a binary sequence.
* **X_features:** A formula for extracting node features, given by σ(Kσ(KXW⁰)W¹), where σ represents a sigmoid function, K is a matrix, X is the feature matrix, and W⁰ and W¹ are weight matrices.
### Detailed Analysis
**Top Graph:**
* **Nodes and Connections:** Nodes 1, 2, and 3 form a triangle. Node 4 is connected only to node 3.
* **Node Features:**
* Node 1: Gray, Yellow, Blue, Orange
* Node 2: Gray, Orange, Blue
* Node 3: Yellow, Blue, Orange
* Node 4: Green, Orange, Blue
* **Adjacency Matrix (A):**
```
[1 1 1 0]
[1 1 1 0]
[1 1 1 1]
[0 0 1 1]
```
This matrix represents the connections: 1-2, 1-3, 2-3, and 3-4.
* **Feature Matrix (X):** Represented by the colored blocks associated with each node.
* **X_topo:** [1 1 0 1 0 1]
* **X_features:** σ(Kσ(KXW⁰)W¹)
**Bottom Graph:**
* **Nodes and Connections:** Nodes 1, 2, 3, and 4 form a square.
* **Node Features:**
* Node 1: Yellow, Blue, Orange
* Node 2: Green, Orange, Blue
* Node 3: Green, Blue, Gray
* Node 4: Gray, Orange, Blue
* **Adjacency Matrix (A):**
```
[1 1 1 0]
[1 1 0 1]
[1 0 1 1]
[0 1 1 1]
```
This matrix represents the connections: 1-2, 1-3, 2-4, and 3-4.
* **Feature Matrix (X):** Represented by the colored blocks associated with each node.
* **X_topo:** [1 1 0 0 1 1]
* **X_features:** σ(Kσ(KXW⁰)W¹)
### Key Observations
* The adjacency matrix (A) accurately reflects the connections between nodes in each graph.
* The feature matrix (X) is visually represented by the colored blocks, but the specific numerical values are not provided.
* The X_topo vector differs between the two graphs, reflecting the different topological structures.
* The X_features formula is the same for both graphs, suggesting a consistent feature extraction process.
### Interpretation
The image illustrates how graph structures can be represented mathematically using adjacency matrices and feature matrices. The colored blocks represent node features, which are then processed using a feature extraction formula to obtain X_features. The X_topo vector captures the topological properties of the graph. The entire diagram demonstrates a basic framework for graph representation and feature extraction, which is a fundamental concept in graph neural networks and other graph-based machine learning models. The formula for X_features suggests a neural network layer with weight matrices W⁰ and W¹ and a non-linear activation function σ. The matrix K likely represents a graph convolution operation.