\n
## Diagram: Graph Neural Network Representation
### Overview
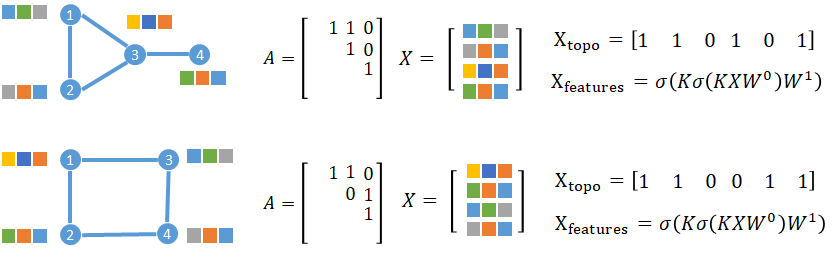
The image presents two diagrams illustrating the representation of graph neural networks. Each diagram consists of a graph structure, an adjacency matrix (A), a feature matrix (X), and equations defining topological features (X<sub>topo</sub>) and learned features (X<sub>features</sub>). The diagrams demonstrate how graph structures can be represented mathematically for use in neural networks.
### Components/Axes
Each diagram contains the following components:
* **Graph Structure:** A visual representation of a graph with nodes and edges. Nodes are colored with a pattern of orange, blue, and grey.
* **Adjacency Matrix (A):** A 3x3 matrix representing the connections between nodes in the graph.
* **Feature Matrix (X):** A 4x3 matrix representing the features associated with each node.
* **Equations:** Two equations defining X<sub>topo</sub> and X<sub>features</sub>.
* X<sub>topo</sub> = \[1 1 0 1 0 1]
* X<sub>features</sub> = σ(Kσ(KXW<sup>0</sup>)W<sup>1</sup>)
* Where σ is the sigmoid function, K is a kernel, and W<sup>0</sup> and W<sup>1</sup> are weight matrices.
### Detailed Analysis or Content Details
**Diagram 1 (Top)**
* **Graph Structure:** The graph has 4 nodes labeled 1, 2, 3, and 4. Node 1 is connected to nodes 2 and 3. Node 2 is connected to node 3. Node 3 is connected to node 4.
* **Adjacency Matrix (A):**
```
[ 1 1 0 ]
[ 1 0 1 ]
[ 0 1 1 ]
```
* **Feature Matrix (X):**
```
[ Blue Orange Grey ]
[ Grey Blue Orange ]
[ Orange Grey Blue ]
[ Blue Grey Orange ]
```
* **X<sub>topo</sub>:** \[1 1 0 1 0 1]
* **X<sub>features</sub>:** σ(Kσ(KXW<sup>0</sup>)W<sup>1</sup>)
**Diagram 2 (Bottom)**
* **Graph Structure:** The graph has 4 nodes labeled 1, 2, 3, and 4. Node 1 is connected to node 3. Node 2 is connected to node 4. Node 3 is connected to node 4.
* **Adjacency Matrix (A):**
```
[ 1 0 1 ]
[ 0 1 1 ]
[ 1 1 0 ]
```
* **Feature Matrix (X):**
```
[ Grey Blue Orange ]
[ Orange Grey Blue ]
[ Blue Orange Grey ]
[ Grey Blue Orange ]
```
* **X<sub>topo</sub>:** \[1 1 0 0 1 1]
* **X<sub>features</sub>:** σ(Kσ(KXW<sup>0</sup>)W<sup>1</sup>)
### Key Observations
* The adjacency matrices represent the connectivity of the graphs. A '1' indicates a connection between two nodes, while a '0' indicates no connection.
* The feature matrices represent the features associated with each node. The colors in the matrix correspond to the colors of the nodes in the graph.
* The X<sub>topo</sub> vector appears to be a flattened representation of the graph's structure, potentially indicating node presence or absence in specific contexts.
* The X<sub>features</sub> equation suggests a non-linear transformation of node features using a kernel function (K) and weight matrices (W<sup>0</sup>, W<sup>1</sup>), followed by a sigmoid activation function (σ).
### Interpretation
These diagrams illustrate a method for representing graphs in a format suitable for processing by neural networks. The adjacency matrix and feature matrix provide a numerical representation of the graph's structure and node attributes. The equations for X<sub>topo</sub> and X<sub>features</sub> suggest a process for extracting topological features and learning node representations through a neural network architecture. The use of a kernel function and sigmoid activation function indicates a non-linear transformation of the node features, allowing the network to learn complex relationships between nodes. The two diagrams demonstrate how different graph structures can be represented and processed using this approach. The differences in the adjacency matrices and feature matrices reflect the unique connectivity and attributes of each graph.