## Diagram: Graph Neural Network Feature Propagation
### Overview
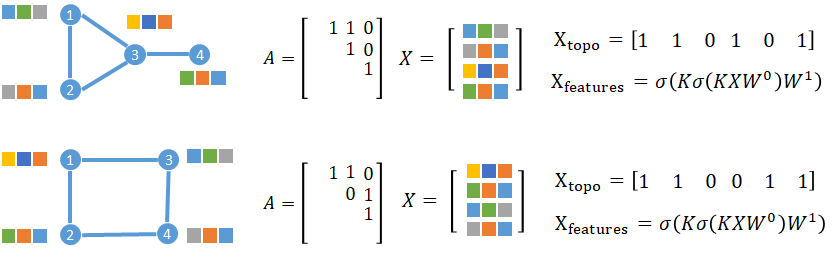
The image presents two graph-based diagrams (labeled A) with associated matrices and equations, illustrating feature propagation in graph neural networks. Each diagram includes:
- A graph structure with 4 nodes (1-4)
- A 3x3 adjacency matrix (A)
- A 3x4 feature matrix (X)
- Topological feature vector (X_topo)
- Feature transformation equation (X_features)
### Components/Axes
**Diagram Elements:**
- **Nodes**: Labeled 1-4 with color-coded blocks (blue, green, orange, gray)
- **Edges**: Connectivity patterns differ between diagrams
- **Color Blocks**: 3 blocks per diagram, arranged in rows corresponding to matrix X
**Matrices:**
1. **Adjacency Matrix (A):**
- Top Diagram:
```
[1 1 0]
[1 0 1]
[1 1 1]
```
- Bottom Diagram:
```
[1 1 0]
[0 1 1]
[1 1 1]
```
2. **Feature Matrix (X):**
- Top Diagram:
```
[blue green gray]
[gray orange blue]
[yellow blue orange]
```
- Bottom Diagram:
```
[yellow blue orange]
[green orange blue]
[blue green gray]
```
**Vectors/Equations:**
- **X_topo**:
- Top: `[1 1 0 1 0 1]`
- Bottom: `[1 1 0 0 1 1]`
- **X_features**:
```
σ(Kσ(KXW⁰)W¹)
```
(Appears identical in both diagrams)
### Detailed Analysis
**Adjacency Matrix Trends:**
- Both diagrams share identical A matrices except for position (2,1) and (2,2):
- Top: A[2,1]=1, A[2,2]=0
- Bottom: A[2,1]=0, A[2,2]=1
**Feature Matrix Patterns:**
- Color coding corresponds to feature dimensions:
- Blue = Dimension 1
- Green = Dimension 2
- Orange = Dimension 3
- Gray = Dimension 4
- Top diagram shows feature permutation between rows 1-3
- Bottom diagram shows different feature permutation
**Topological Vector Analysis:**
- X_topo represents node activation patterns:
- Top: Nodes 1,2,4 active (1s) with node 3 partially active
- Bottom: Nodes 1,2,4 fully active with node 3 inactive in position 4
### Key Observations
1. **Graph Topology Impact**:
- Top diagram (tree structure) shows asymmetric connectivity
- Bottom diagram (cycle) creates closed-loop propagation
- Different X_topo outputs reflect structural differences
2. **Feature Matrix Relationships:**
- Color permutations in X matrix correlate with node connections
- Gray blocks (dimension 4) appear in specific positions matching adjacency patterns
3. **Equation Consistency:**
- Identical X_features equation suggests shared transformation logic
- Different inputs (X matrices) produce different X_topo outputs
### Interpretation
This visualization demonstrates how graph topology influences feature propagation in neural networks:
- The adjacency matrix (A) defines node relationships
- The feature matrix (X) encodes node attributes
- The transformation equation (X_features) applies learnable parameters (W) through multiple σ activations
- Topological differences (tree vs cycle) create distinct feature propagation paths, evidenced by varying X_topo vectors
- The consistent equation structure across diagrams suggests a generalizable model architecture adaptable to different graph topologies
The color-coded blocks provide spatial grounding for feature dimensions, while the matrices quantitatively represent these relationships. This setup appears to model graph convolution operations where node features are aggregated based on local connectivity patterns.