# Technical Data Extraction: Average JS Divergence Heatmap
## 1. Image Overview
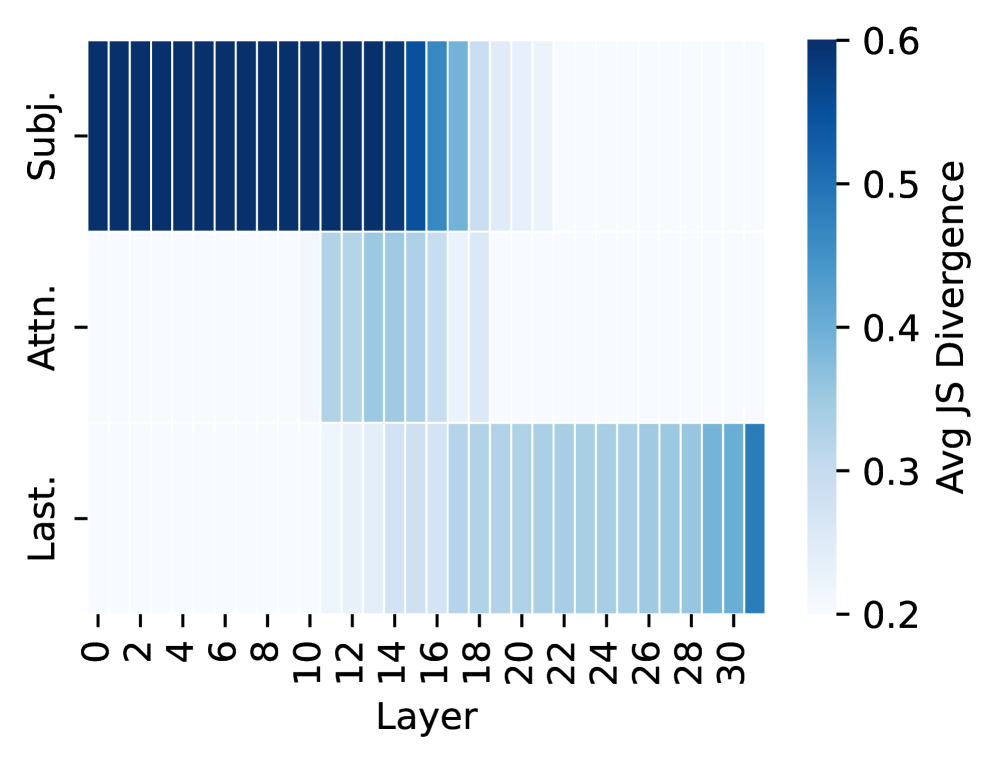
This image is a heatmap visualization representing the **Avg JS Divergence** (Average Jensen-Shannon Divergence) across different layers of a neural network model. The data is categorized by three distinct components or methods across 32 layers.
## 2. Component Isolation
### A. Header/Axes
* **Y-Axis (Left):** Categorical labels representing different components:
* `Subj.` (Top row)
* `Attn.` (Middle row)
* `Last.` (Bottom row)
* **X-Axis (Bottom):** Numerical labels representing `Layer` index, ranging from `0` to `30`. The labels are placed at intervals of 2 (0, 2, 4, 6, 8, 10, 12, 14, 16, 18, 20, 22, 24, 26, 28, 30). There are 32 vertical columns in total (0-31).
* **Legend/Color Bar (Right):** A vertical gradient scale labeled `Avg JS Divergence`.
* **Range:** 0.2 (Lightest blue/white) to 0.6 (Darkest blue).
* **Markers:** 0.2, 0.3, 0.4, 0.5, 0.6.
### B. Main Chart Area (Heatmap Data)
The heatmap consists of a grid of 3 rows by 32 columns.
#### Row 1: `Subj.` (Subject-related divergence)
* **Trend:** High divergence in early layers, sharp drop-off in middle layers, near-zero divergence in late layers.
* **Data Points:**
* **Layers 0–15:** Darkest blue (~0.6). Indicates maximum divergence.
* **Layers 16–17:** Medium-light blue (~0.35 - 0.4). Transition phase.
* **Layers 18–31:** Very light blue to white (~0.2). Indicates minimal divergence.
#### Row 2: `Attn.` (Attention-related divergence)
* **Trend:** Near-zero divergence throughout most of the model, with a localized peak in the middle layers.
* **Data Points:**
* **Layers 0–10:** White (~0.2).
* **Layers 11–15:** Light blue (~0.3).
* **Layers 16–17:** Very light blue (~0.25).
* **Layers 18–31:** White (~0.2).
#### Row 3: `Last.` (Last-token/Final-state divergence)
* **Trend:** Near-zero divergence in early and middle layers, followed by a steady increase in the final third of the model.
* **Data Points:**
* **Layers 0–10:** White (~0.2).
* **Layers 11–17:** Very light blue (~0.22 - 0.25).
* **Layers 18–30:** Gradual increase in blue saturation (~0.3 - 0.4).
* **Layer 31:** Noticeable jump to a darker blue (~0.45 - 0.5).
## 3. Summary of Key Findings
* **Phase Separation:** The three components show high divergence at different stages of the model's depth. `Subj.` dominates the first half (Layers 0-15), `Attn.` has a minor peak in the middle (Layers 11-15), and `Last.` increases in the final third (Layers 18-31).
* **Maximum Divergence:** The highest recorded divergence (~0.6) occurs in the `Subj.` component during the initial 16 layers.
* **Minimum Divergence:** All components reach the baseline of ~0.2 at various points, specifically `Attn.` and `Last.` in the earliest layers, and `Subj.` in the final layers.