## Heatmap: Jensen-Shannon Divergence by Layer and Representation
### Overview
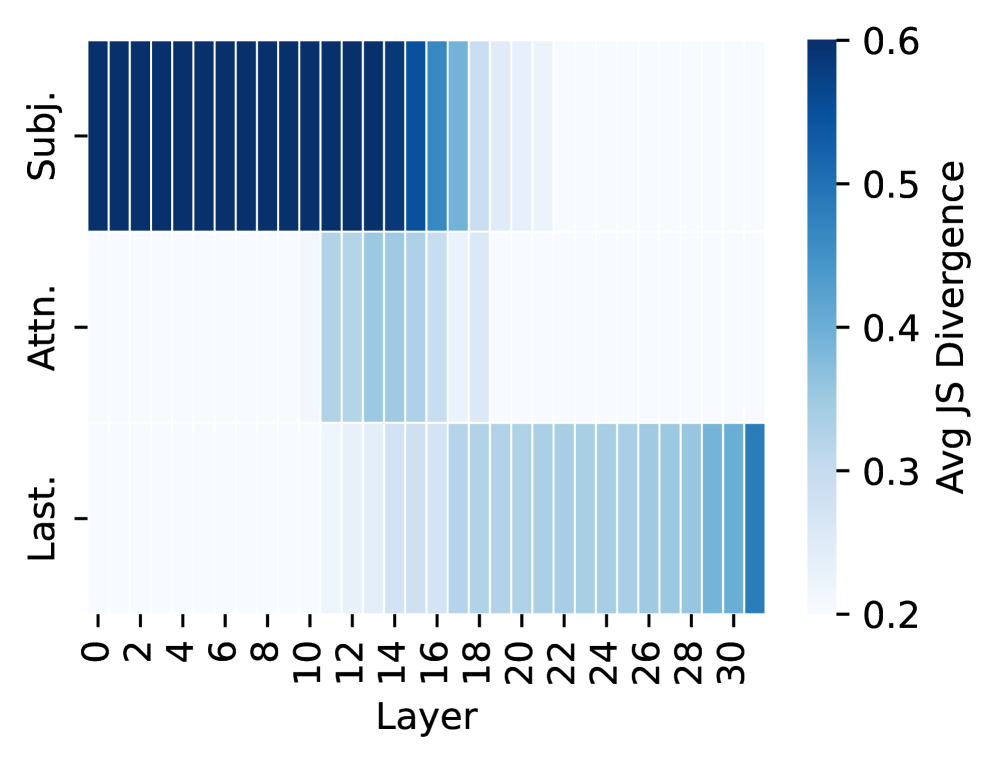
This image presents a heatmap visualizing the average Jensen-Shannon (JS) Divergence across different layers of a model, for three different representations: Subject ("Subj."), Attention ("Attn."), and Last Layer ("Last."). The heatmap's color intensity corresponds to the magnitude of the JS Divergence, with darker blues indicating higher divergence and lighter blues indicating lower divergence.
### Components/Axes
* **X-axis:** "Layer" - Ranges from 0 to 30, with increments of 2.
* **Y-axis:** Representation Type - Three categories: "Subj." (Subject), "Attn." (Attention), and "Last." (Last Layer).
* **Color Scale (Right):** "Avg JS Divergence" - Ranges from 0.2 to 0.6, with a gradient from light blue to dark blue.
* **Legend:** Located in the top-right corner, visually mapping color intensity to JS Divergence values.
### Detailed Analysis
The heatmap is structured as a 3x16 grid (3 rows representing the representation types, and 16 columns representing the layers).
**1. Subject ("Subj.") Representation:**
* **Trend:** The JS Divergence remains relatively high and stable from Layer 0 to Layer 12, approximately around 0.55-0.6. After Layer 12, the divergence decreases gradually, reaching approximately 0.45-0.5 by Layer 30.
* **Data Points (Approximate):**
* Layer 0: ~0.58
* Layer 2: ~0.59
* Layer 4: ~0.58
* Layer 6: ~0.59
* Layer 8: ~0.58
* Layer 10: ~0.59
* Layer 12: ~0.57
* Layer 14: ~0.54
* Layer 16: ~0.51
* Layer 18: ~0.48
* Layer 20: ~0.46
* Layer 22: ~0.44
* Layer 24: ~0.42
* Layer 26: ~0.41
* Layer 28: ~0.40
* Layer 30: ~0.40
**2. Attention ("Attn.") Representation:**
* **Trend:** The JS Divergence starts at approximately 0.4 at Layer 0 and decreases steadily until Layer 14, reaching a minimum of around 0.3. From Layer 14 to Layer 30, the divergence increases slightly, but remains below 0.4.
* **Data Points (Approximate):**
* Layer 0: ~0.41
* Layer 2: ~0.39
* Layer 4: ~0.37
* Layer 6: ~0.35
* Layer 8: ~0.34
* Layer 10: ~0.33
* Layer 12: ~0.32
* Layer 14: ~0.30
* Layer 16: ~0.32
* Layer 18: ~0.34
* Layer 20: ~0.36
* Layer 22: ~0.38
* Layer 24: ~0.39
* Layer 26: ~0.40
* Layer 28: ~0.40
* Layer 30: ~0.41
**3. Last Layer ("Last.") Representation:**
* **Trend:** The JS Divergence begins at approximately 0.25 at Layer 0 and increases steadily to around 0.35 by Layer 14. After Layer 14, the divergence remains relatively stable, fluctuating between 0.3 and 0.35 until Layer 30.
* **Data Points (Approximate):**
* Layer 0: ~0.25
* Layer 2: ~0.27
* Layer 4: ~0.29
* Layer 6: ~0.30
* Layer 8: ~0.31
* Layer 10: ~0.32
* Layer 12: ~0.33
* Layer 14: ~0.35
* Layer 16: ~0.34
* Layer 18: ~0.33
* Layer 20: ~0.32
* Layer 22: ~0.33
* Layer 24: ~0.34
* Layer 26: ~0.33
* Layer 28: ~0.34
* Layer 30: ~0.34
### Key Observations
* The "Subj." representation consistently exhibits the highest JS Divergence across all layers.
* The "Attn." representation shows the most significant decrease in JS Divergence from Layer 0 to Layer 14.
* The "Last." representation has the lowest JS Divergence overall, indicating the most stable representation.
* There appears to be a point around Layer 12-14 where the divergence behavior changes for all three representations.
### Interpretation
This heatmap likely represents an analysis of the representational similarity of different layers within a neural network. The Jensen-Shannon Divergence measures the similarity between probability distributions. Higher divergence suggests greater dissimilarity, potentially indicating that the representations are becoming more distinct or specialized as information flows through the network.
The consistently high divergence in the "Subj." representation suggests that the subject-related information remains relatively diverse and complex throughout the layers. The decreasing divergence in the "Attn." representation could indicate that the attention mechanism is converging on a more focused and consistent set of features. The low and stable divergence in the "Last." representation suggests that the final layer produces a relatively stable and consolidated representation.
The change in behavior around Layer 12-14 might correspond to a key architectural component or a significant learning phase within the network. Further investigation would be needed to determine the specific cause of this shift. The data suggests that the model's representations evolve differently depending on the type of information being processed (subject, attention, or final output).