## Heatmap: Average Jensen-Shannon Divergence Across Model Layers
### Overview
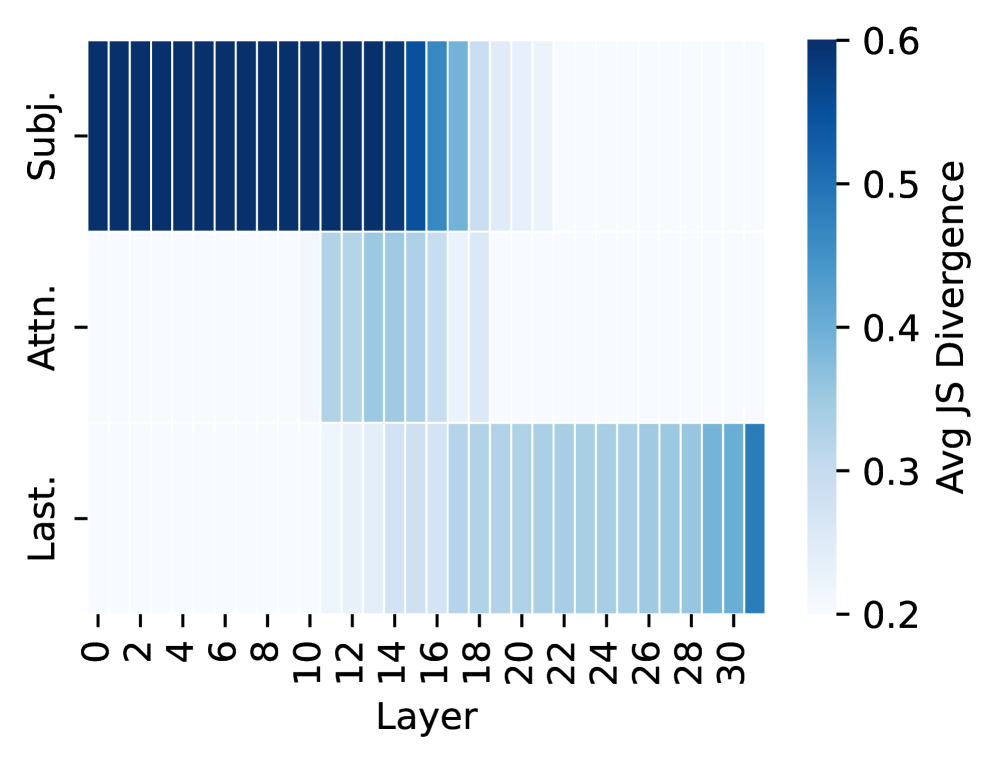
The image is a heatmap visualizing the average Jensen-Shannon (JS) Divergence across 31 layers (0-30) of a model, broken down into three distinct categories or components labeled on the y-axis. The divergence is represented by a color gradient, with darker blue indicating higher divergence values.
### Components/Axes
* **X-Axis (Horizontal):** Labeled "Layer". It has numerical markers from 0 to 30 in increments of 2 (0, 2, 4, ..., 30).
* **Y-Axis (Vertical):** Contains three categorical labels, positioned from top to bottom:
1. **Subj.** (Top row)
2. **Attn.** (Middle row)
3. **Last.** (Bottom row)
* **Color Scale/Legend:** Positioned vertically on the right side of the chart. It is labeled "Avg JS Divergence". The scale ranges from 0.2 (lightest blue/white) to 0.6 (darkest blue), with intermediate markers at 0.3, 0.4, and 0.5.
### Detailed Analysis
The heatmap displays three distinct horizontal bands, each corresponding to a y-axis category. The color intensity (divergence value) varies significantly across layers for each band.
1. **"Subj." Row (Top):**
* **Trend:** Shows very high divergence in the early layers, which sharply decreases in the middle layers and remains low in the later layers.
* **Data Points:** Layers 0 through approximately 16 are colored in the darkest blue, indicating an average JS Divergence at or near the maximum of **~0.6**. From layer 17 onward, the color lightens dramatically to a very pale blue/white, indicating a divergence value at or near the minimum of **~0.2**.
2. **"Attn." Row (Middle):**
* **Trend:** Shows a localized peak of moderate divergence in the middle layers, with very low divergence in both early and late layers.
* **Data Points:** Layers 0-10 and 18-30 are very pale, indicating divergence **~0.2**. A distinct block of light-to-medium blue appears between layers 11 and 17. The peak divergence within this block (around layers 13-15) corresponds to a color suggesting a value of approximately **0.3 to 0.35**.
3. **"Last." Row (Bottom):**
* **Trend:** Shows a gradual increase in divergence from the middle layers to the final layers.
* **Data Points:** Layers 0-17 are very pale (**~0.2**). Starting around layer 18, the color begins to darken progressively. By layers 28-30, the color is a medium blue, indicating a divergence value of approximately **0.4 to 0.45**.
### Key Observations
* **Spatial Segregation of Activity:** The three components ("Subj.", "Attn.", "Last.") exhibit high divergence in largely non-overlapping layer ranges. "Subj." dominates early layers (0-16), "Attn." peaks in mid-layers (11-17), and "Last." becomes prominent in late layers (18-30).
* **Magnitude Differences:** The "Subj." component reaches the highest divergence values (~0.6), significantly higher than the peaks of "Attn." (~0.35) and "Last." (~0.45).
* **Sharp vs. Gradual Transitions:** The drop in divergence for "Subj." is abrupt after layer 16. In contrast, the rise for "Last." is more gradual.
### Interpretation
This heatmap likely visualizes the functional specialization or information processing dynamics within a deep neural network (e.g., a Transformer model). The Jensen-Shannon Divergence measures the difference between probability distributions, so high values indicate layers where the model's internal representations for a given component are changing significantly or are distinct from a baseline.
* **"Subj." (Subject):** The high early-layer divergence suggests that processing related to the "subject" of the input (e.g., identifying entities, subjects in a sentence) is a primary and highly variable activity in the initial stages of the model.
* **"Attn." (Attention):** The mid-layer peak indicates that attention mechanism computations become most distinctive or variable in the middle of the network, possibly where complex relationships between elements are being resolved.
* **"Last." (Last Layer/Output):** The increasing divergence in final layers reflects the specialization and refinement of representations as they are prepared for the model's final output task.
The clear spatial separation implies a sequential processing pipeline: the model first heavily processes subject-related information, then focuses on attention-based integration, and finally prepares the output. The higher magnitude for "Subj." could indicate that initial feature extraction is a more variable or fundamental process than the later, more constrained stages of computation.